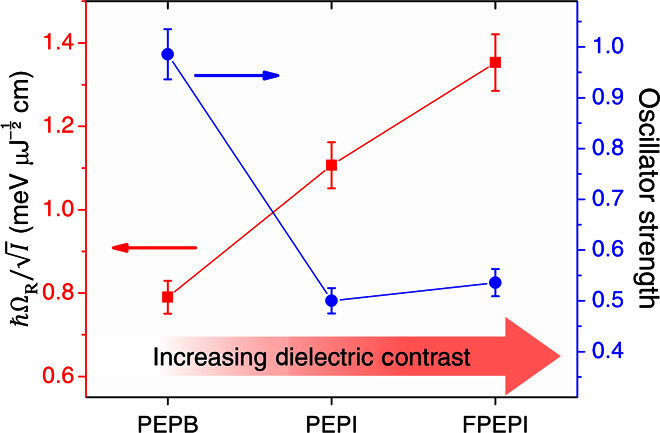
Fig. 4. Correlation between the Rabi energy and the oscillator strength or dielectric contrast.

Measurement of Rabi energy via OSE on various lead-based 2D perovskite systems (that is, PEPB, PEPI, and FPEPI). There is a clear increasing relation between (red) and the dielectric contrast. Meanwhile, no clear correlation is observed between the oscillator strength (blue) and .
