
Fig. 1. Geologic sequence in South Africa between 2.5 and 2.2 Ga.
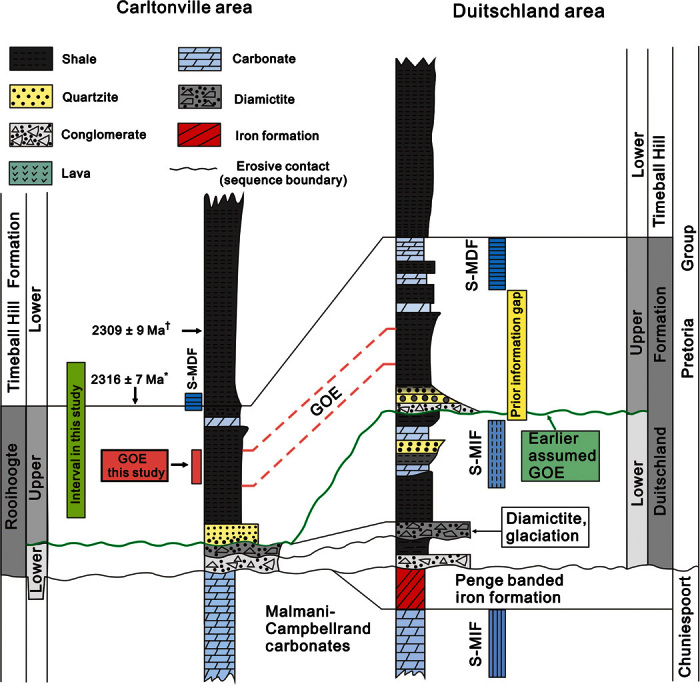
Stratigraphic correlation of the Rooihoogte and Duitschland Formation between the Carltonville and Duitschland area in the Transvaal Basin, South Africa. Note that the diagram is not drawn according to the real stratal thicknesses. The coarse green wavy line represents the sequence boundary in the middle Rooihoogte/Duitschland Formation that was previously proposed as the time interval in which the GOE occurred (34). Previously, the transition from S-MIF to S-MDF was obscured by an apparent hiatus in the Duitschland Formation. The pink interval represents the GOE identified in this study. The dashed vertical lines in the S-MIF box represent small Δ33S values (<2‰), whereas the solid lines represent the presence of large Δ33S values (>2‰). *From Hannah et al. (40). †From Rasmussen et al. (41).