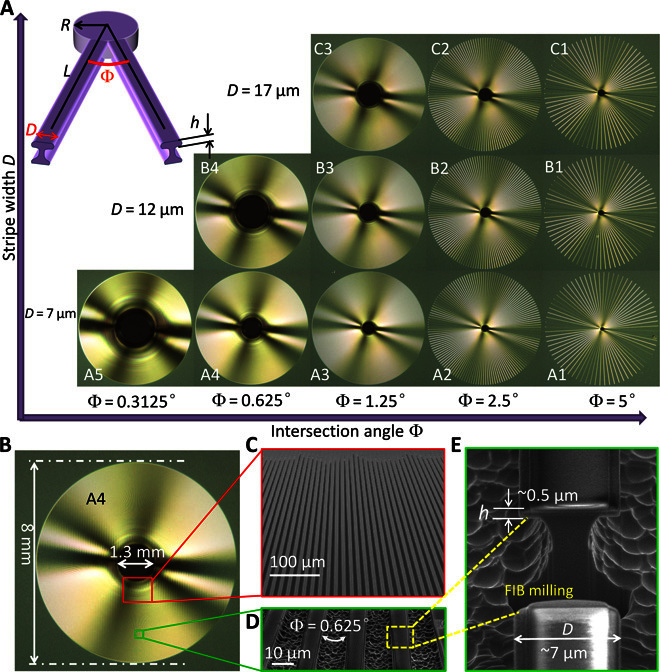
Fig. 2. The fabricated patterns composed of radially arrayed undercut microstripes.

(A) Photographs of 12 samples with systematically varied parameters. Inset: Schematic illustration of the two neighboring stripes with the undercut structure. D is the stripe width, Φ is the intersection angle between two neighboring stripes, R is the radius of the central circle formed by intersection of the stripes, h is the undercut thickness, and L is the distance to the center. (B to E) Structure details of a typical A4 sample. (C) Scanning electron microscope (SEM) image near the center shows radially arrayed microstripes. (D) Magnified image of the radial stripes far from the center. (E) Cross-sectional view of an individual stripe reveals the undercut profile. The stripe was locally removed by focused ion beam (FIB) milling to expose the cross-sectional morphology.
