
Fig. 4. Changes of the different benthic microbial components in relation to latitude.
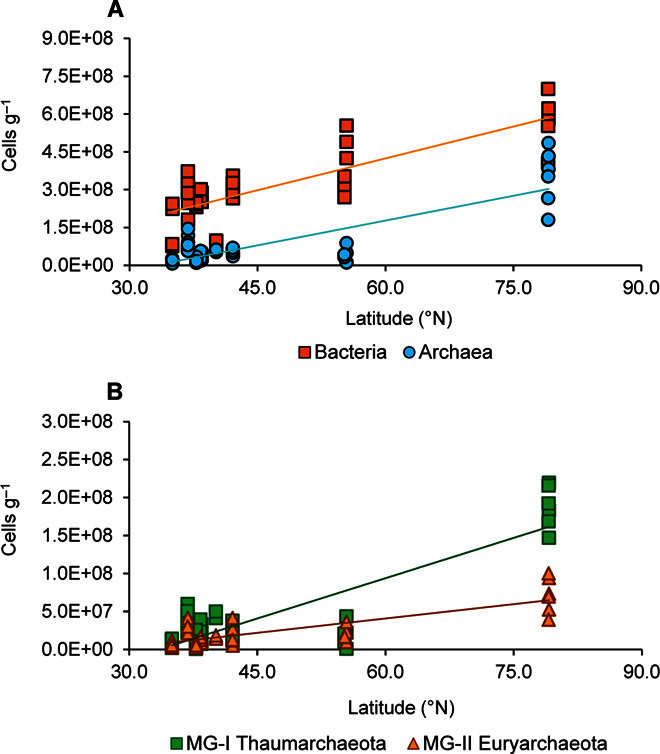
(A and B) Latitudinal patterns of bacterial and archaeal abundances (A) and MG-I Thaumarchaeota and MG-II Euryarchaeota abundances (B) in the top 1 cm of sediments collected in the different oceanic regions at similar depths. The color-coded fitted curves show the correlations for bacteria (Y = 8.42 × 10⁶ X − 8.1 × 10⁷; n = 45; R2 = 0.679; P < 0.01), archaea (Y = 6.56 × 10⁶ X − 2.2 × 10⁸; n = 45; R2 = 0.679; P < 0.01), MG-I Thaumarchaeota (Y = 3.54 × 10⁶ X − 1.2 × 10⁸; n = 45; R2 = 0.747; P < 0.01), and MG-II Euryarchaeota (Y = 1.26 × 10⁶ X − 3.5 × 10⁷; n = 45; R2 = 0.629; P < 0.01).