
Fig. 7. Output of the regression tree analysis carried out to identify environmental factors explaining the distribution of archaeal abundances in the top 1 cm of sediments collected in the different oceanic regions.
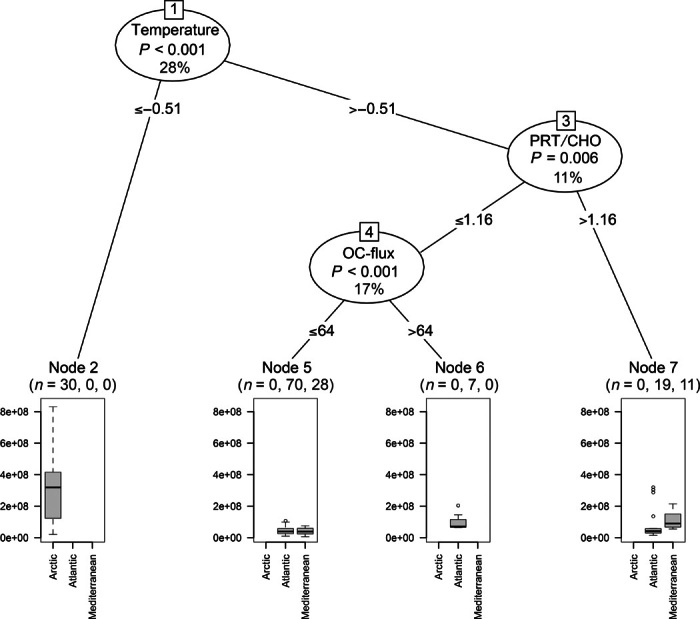
The significance level and the percentage of the explained variance of each predictor variable are reported along with the number of sampling sites for each oceanic region at the terminal nodes. OC flux, organic C that reaches the sea floor through particle sinking (expressed as mg C m−2 day−1); PRT/CHO, protein-to-carbohydrate ratio in the sediment (adimensional).