
Fig. 3. Fine-mapping analysis results of locus rs4925166.
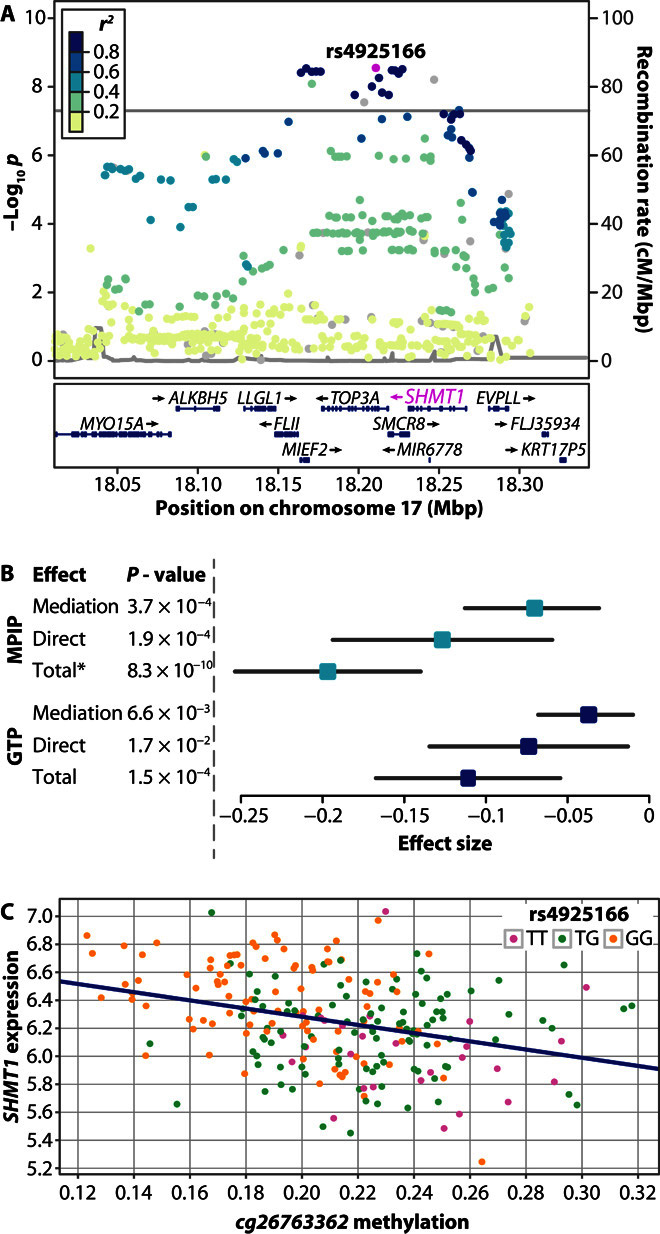
(A) Regional plot for the rs4925166/SHMT1 locus. Color of dots indicates LD with the lead variant (rs4925166; pink). Gray dots represent signals with missing r2 values. cM, centimorgan. (B) Mediation analysis results in MPIP/GTP controls. Mediation effect: rs4925166→CpG cg26763362→SHMT1 expression. Direct effect: rs4925166→SHMT1 expression. Data have been calculated using the R package mediation (30), except for total effect (*), which was calculated by linear regression. Results were obtained using 1 million simulations. Effects and P values shown here differ from Table 5, as a lower number of samples contained both expression and methylation data than expression data alone. (C) Relationship between cg26763362 methylation, SHMT1 expression, and rs4925166 genotype in MPIP controls.