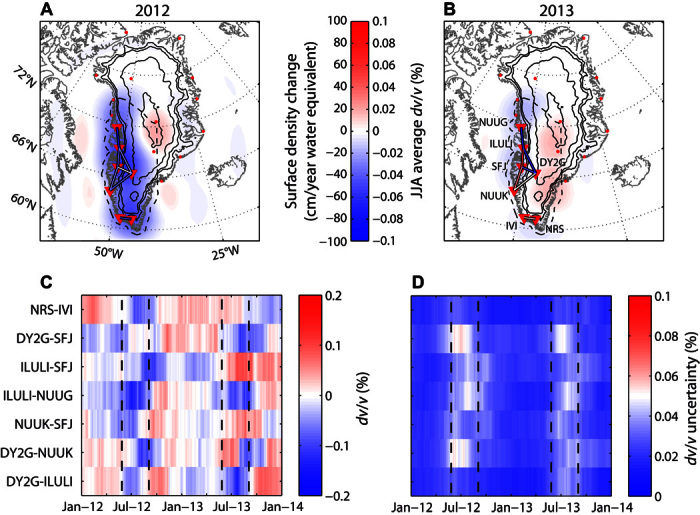
Fig. 1. Ice mass balance and measured velocity variations.

(A) Map of the ice mass changes over southwest Greenland in 2012. The stations used in this study are indicated by inverted triangles; the other Greenland stations of the Greenland Ice Sheet Monitoring Network (GLISN) are indicated by red dots. The colored lines between the stations show the dv/v averaged over the summer months June, July, and August (JJA). The black contours show the ice thickness at a 1000-m increment; the dashed black curve shows the contour used to integrate the ice mass changes from GRACE data. (B) Same as (A) for 2013. (C) Time series of the relative velocity variations. (D) Time series of the relative velocity variation uncertainties. The summer months are between dashed vertical lines.
