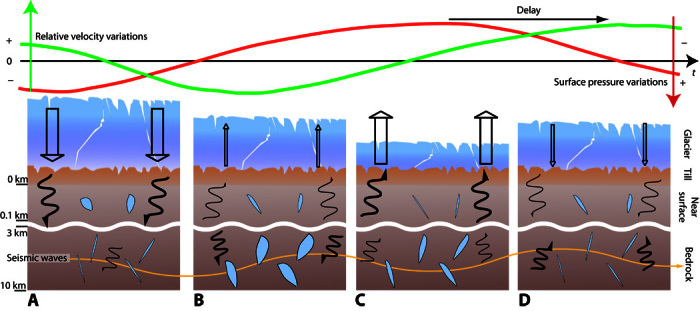
Fig. 3. Pore pressure diffusion in the Greenland crust through a till layer.

The straight arrow indicates surface pressure and the wavy arrow indicates pore pressure diffusion; the thickness of the arrows indicates the amplitude of the pressure change. (A) Maximum pressure at Earth’s surface due to snow accumulation. The pore pressure change at depth is delayed by the bedrock and the till layer. The change is felt in the near surface and then starts to be felt at depth. (B) The maximum pore pressure change has reached the depth sampled by the seismic waves, and the relative velocity variation is therefore minimum. Meanwhile, surface pressure decreases as a result of ice melting and atmospheric pressure variations. (C) The surface pressure change reaches its minimum, followed by the pore pressure in the near surface. At depth, the pore pressure continues to decrease, whereas the velocity continues to increase. (D) Surface pressure starts to increase again. At depth, pore pressure is minimum, and relative velocity variation is maximum. Sections are not to scale.
