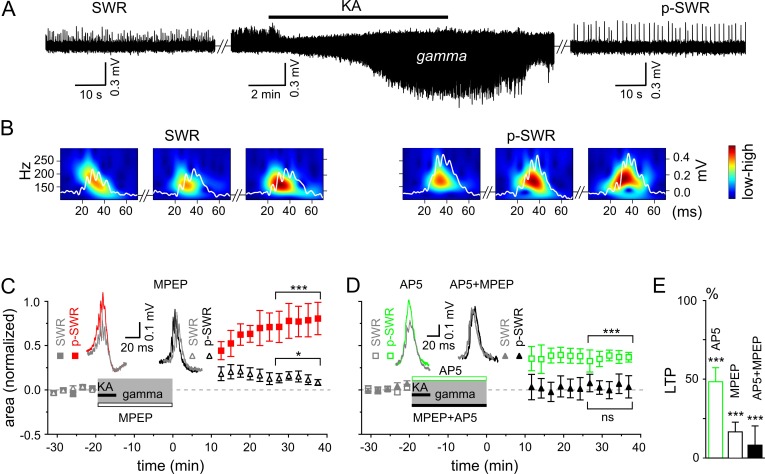
Figure 2. Gamma rhythms promote long-lasting alterations in the network activity.
(A) SWRs recorded in the stratum pyramidale of the CA3 region occurred spontaneously (left), disappeared shortly after bath application of KA (middle) and reappeared with a significantly higher amplitude after KA washout (right). (B) Example of the wavelet transform (color-coded power spectral density) for three consecutive highlighted SWRs (white trace) before (SWR) and after (p-SWR) intermediate gamma oscillations. (C) p-SWR areas (red-filled squares) increased significantly compared to the SWR areas (gray-filled squares). MPEP (50 µM) administration largely prevented p-SWR area increase (black, open triangles). The time courses of drug applications are depicted schematically. The horizontal lines mark the p-SWR data points used for statistical analyses. The significance stars compare the pre-gamma data with the marked post-gamma data. The number of asterisks indicates the significance level (Student's t-test). Insert, examples of SWR (gray) and p-SWR (red and black) without (left) and with MPEP (right) administration during gamma rhythms. (D) Effects of AP5 (50 µM, green open squares) and MPEP+AP5 (black filled triangles) on SWR area increase. Insert, examples of corresponding SWR (gray) and p-SWR (green and black). (E) Gamma oscillation-induced SWR area increase (LTP) is reduced significantly by administration of AP5 (green open bar), MPEP (black open bar) and MPEP+AP5 (black filled bar).

