. 2016 May 24;5:e14679. doi: 10.7554/eLife.14679

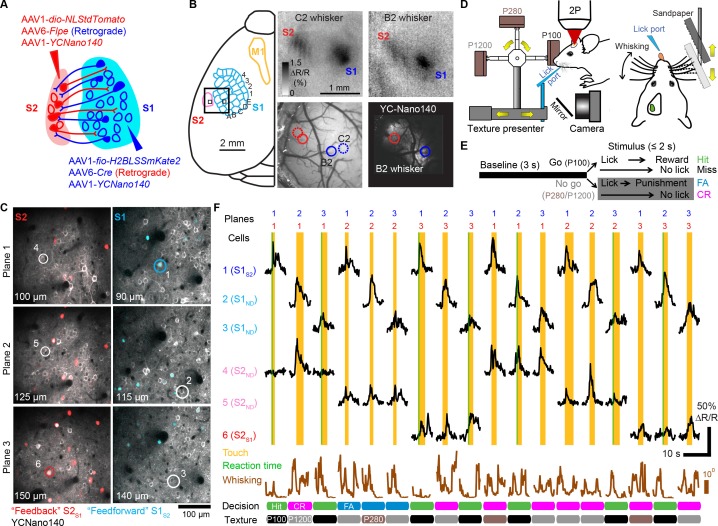
Figure 2. Simultaneous calcium imaging of identified feedforward and feedback neurons in S1 and S2 of mouse neocortex during behavior.

(A) Viral injection scheme for simultaneous labeling of feedforward and feedback neurons and YC-Nano140 expression. (B) Functional mapping of S1 and S2 through optical intrinsic signal imaging. Intrinsic signals evoked by stimulation of the C2 whisker (top left) and the B2 whisker (top right). In addition to localized intrinsic signals in S1 barrel columns, additional activation spots are visible in S2. Identified barrel columns (circles) are overlaid over blood vessel (bottom left) and YC-Nano140 expression (bottom right) images. (C) In vivo 2-photon images of LSSmKate2-positive S1S2 neurons (blue), tdTomato-positive S2S1 neurons (red) with non-co-labeled YC-Nano140-expressing neurons (grey) in S1 (S1ND) and S2 (S2ND). (D) Behavior setup for texture discrimination task. (E) Trial structure for go/no-go texture discrimination task. (F) Example calcium transients for individual neurons in [C] measured episodically during texture discrimination task along with periods of whisker-to-texture touch (orange area), whisking amplitude (brown trace), and reaction time on Hit trials (green area). For each trial the selected plane in each sub-area is indicated on top, illustrating the combinatorial plane hopping.

DOI: http://dx.doi.org/10.7554/eLife.14679.007

Figure 2—source data 1. Optimized low tensor rank across animals.
Table of optimum column size of each factor matrices related to neurons (N’ + N’offset), time points (T’), and trial conditions (C’) determined after cross-validation and cost function procedures for each animal used for denoising. Total possible column sizes are also indicated along with number of active neurons.
DOI: 10.7554/eLife.14679.008

Figure 2.

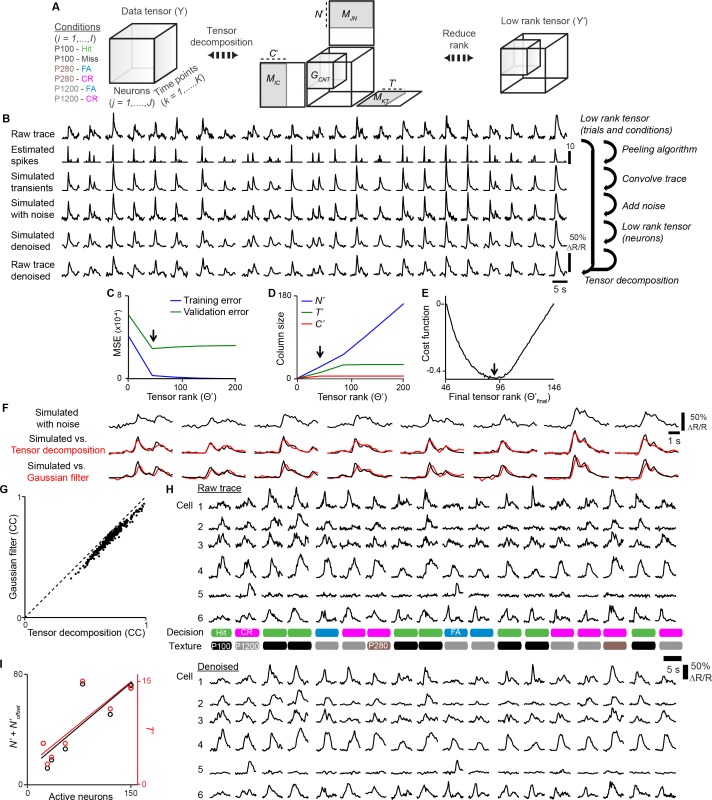
Figure 2—figure supplement 1. Denoising with tensor decomposition.

Figure 2—figure supplement 1.

(A) Calcium responses from one animal across multiple sessions are organized into a data tensor. The tensor is decomposed and a low-rank tensor representing denoised calcium responses is generated. (B) Denoising procedure: A low-rank tensor for trials and conditions was determined by cross-validation methods. A low-rank tensor for neurons was determined by convolving estimated spike trains from experiment data to generate simulated calcium traces. Noise is added to simulate calcium traces and tensor decomposition is performed to determine an optimum low-rank tensor by comparing simulated vs. simulated denoised traces. Once an optimum low rank tensor is determined for all dimensions, tensor decomposition is applied to raw traces. (C) Low tensor rank (arrow) computed by cross-validation of training set. (D) Contribution of each dimension to low tensor rank in [C]. (E) Final low tensor rank offset (arrow) computed by cost function of simulated vs. simulated denoised traces. (F) Comparison of simulated traces denoised with tensor decomposition vs. Gaussian filter. (G) Denoised fits from Gaussian filter vs. tensor decomposition for single neurons from simulated data. (H) Example of experimental data before and after denoising. (I) Optimum T’ or N’ + N’offset vs. active neurons for each animal.