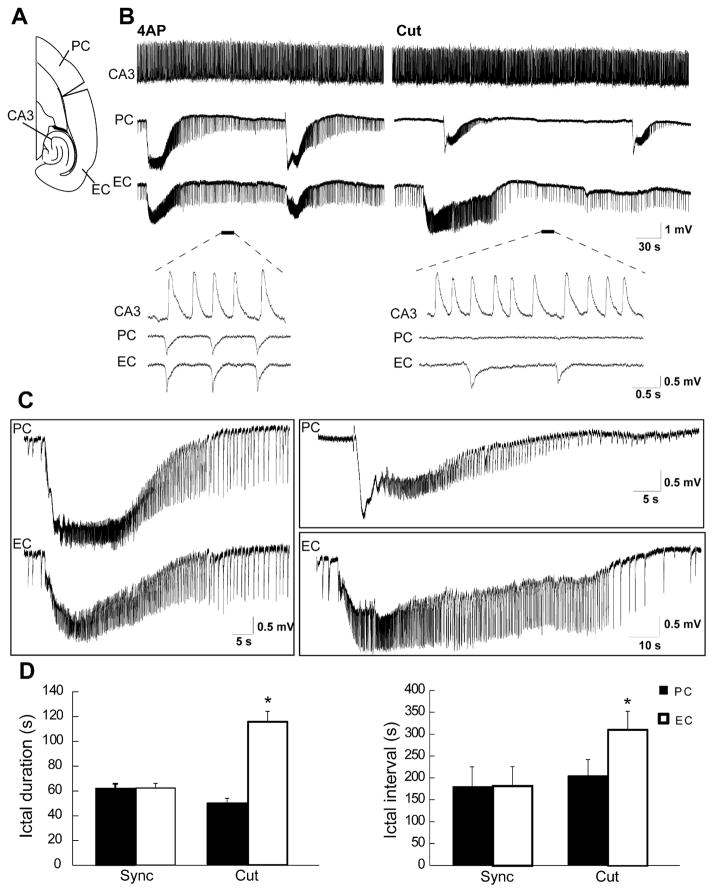
Fig. 4.
(A) Schematic drawing of a horizontal slice containing CA3, PC and EC showing the cut between PC and EC. (B) Field potential recordings obtained from these three areas during application of 4AP before and after removing the connection between PC and EC. Note that before the cut, interictal and ictal discharges recorded in this experiment are synchronous in the PC and EC while independent interictal activity is recorded from the CA3 area. (C) Enlarged portion of the ictal discharges recorded before and after removing the connection between PC and EC shown in B. (D) Bar graphs showing the average duration and interval of ictal discharges recorded from the PC and EC before and after the cut. Note that the cut did not change the duration and interval of occurrence of ictal discharges in PC while increasing them in the EC. *p<0.001.

