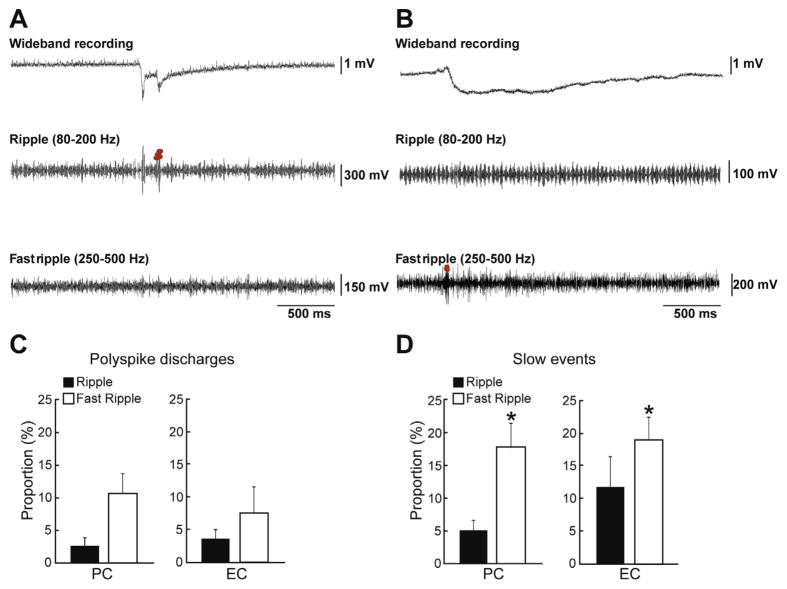
Fig. 6.
(A and B) Examples of a synchronous interictal discharge (A) and of a slow interictal discharge (B) that co-occurred with a ripple or a fast ripple in EC. (C and D) Bar graphs showing the proportion of synchronous interictal discharge (C) and slow interictal (D) discharges co-occurring with ripples and fast ripples in PC and EC. Data were obtained by analyzing 557 synchronous interictal discharge and 95 slow interictal discharges in 6 and 10 brain slices, respectively. Note that the proportions of interictal discharges co-occurring with fast ripples are higher than proportions of interictal discharges co-occurring with ripples for the slow interictal discharges in both regions. *p<0.01.

