Figure 2.
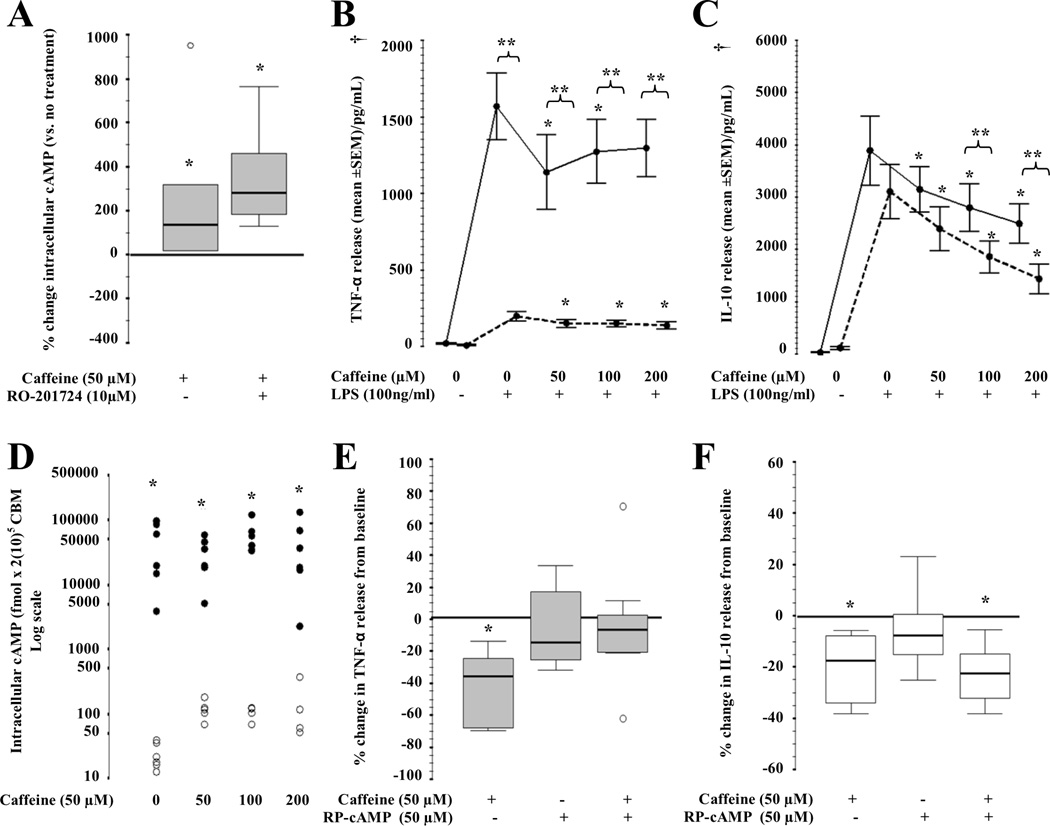
(A) Intracellular cAMP accumulation (fmol /2(10)5 CBM; n=6) following RO-201724 (PDE IV inhibitor) alone and combined with caffeine (50µM). Box and whiskers plot representing median and IQR. *,p<0.05 (Wilcoxon rank test). ○, outliers. (B) TNF-α and (C) IL-10 release from CBM curve in response to caffeine (0, 50, 100, 200 µM) alone (continuous line) or combined (dashed line) with RO-201724 pre-treatment. Mean ± SEM (n=11). *,p<0.01 vs. LPS-activated CBM exposed to 0µM of caffeine (Bonferroni). **, p<0.05 vs. pre-treatment counterpart. †, overall p<0.05 (Two-way repeat measures ANOVA). (D) Intracellular cAMP accumulation (fmol /2(10)5 CBM; log scale; n=6) following caffeine exposure (0, 50, 100, 200 uM) alone (○) and combined (●) with RP-cAMPs (PKA inhibitor; 50 uM) pre-treatment. *,p<0.05 (Wilcoxon rank test). (E) TNF-α (gray) and (F) IL-10 (white) release from CBM curve in response to RP-cAMP and/or caffeine (n=7). *,p<0.05 (Wilcoxon rank test) vs. no treatments. ○, outliers.

