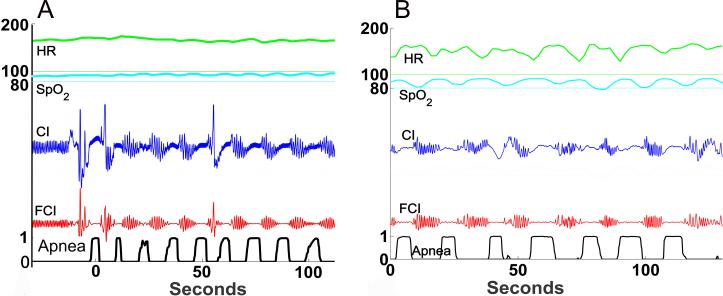
Figure 1. Periodic breathing examples.
Chest impedance waveform data from NICU bedside monitors were analyzed for PB. Graphic representations are shown of 2 minutes of vital sign and waveform data. From top to bottom: Heart rate (HR with 100 beats/minute indicated by the thin green line), oxygen saturation (SpO2 with 80% indicated by the thin blue line), chest impedance (CI), filtered chest impedance (FCI), and computer algorithm-detected probability of apnea based on low variance in the filtered CI signal as previously reported.(28) A wavelet transform analysis of short apneic pauses was previously validated for automated analysis of %time spent in PB(27). A) Example of periodic breathing without significant changes in heart rate or SpO2. B) Example of periodic breathing with decreases in heart rate and SpO2 corresponding to the respiratory pauses.

