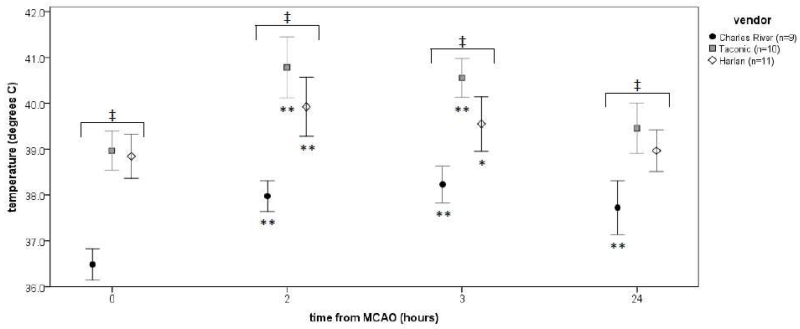
Figure 1.
Temperatures after MCAO. Data are plotted as the mean (± standard deviation). Differences in temperature between vendors is assessed by ANOVA and noted by ‡ (P<0.001). Differences from baseline temperatures after MCAO among animals from a single vendor is assessed by paired t-test and noted by *(P<0.05) and **(P<0.01).

