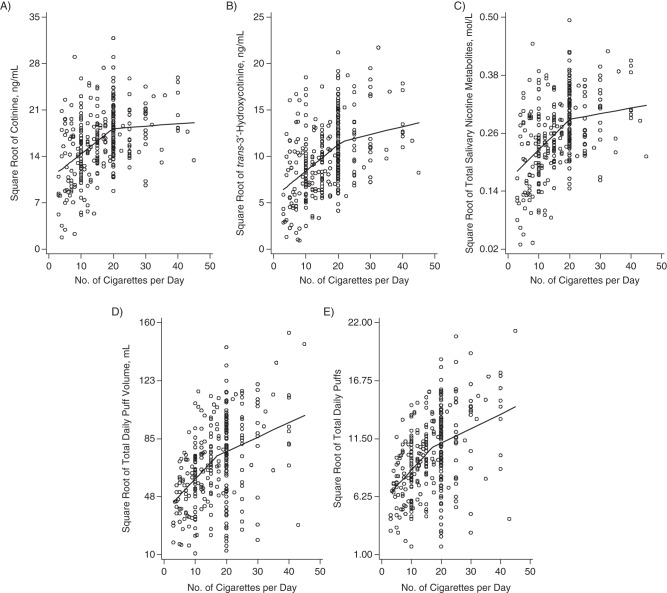
Figure 2.
Plots of the regression of cotinine (A), trans-3′-hydroxycotinine (B), total salivary nicotine metabolites (C), total daily puff volume (D), and total daily number of puffs (E) on number of cigarettes smoked per day among 332 participants from the Pennsylvania Adult Smoking Study, 2012–2014. Dependent variables were square-root-transformed.

