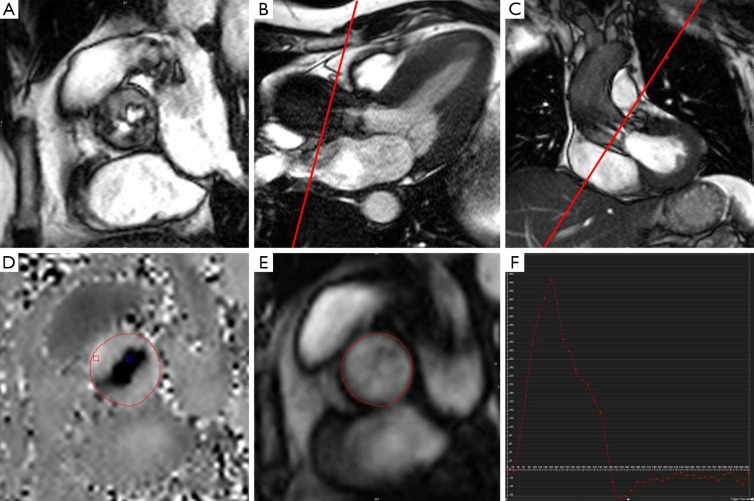
Figure 3.
Velocity encoded phase contrast (PC) imaging to quantify aortic stenosis. (A) Short-axis view indicating a bicuspid valve with double-barrelled orifice; (B) transverse LVOT views obtained using steady state free precession; (C) sagittal LVOT view used to plan imaging planes for pc acquisition; (D) phase velocity map; (E) magnitude image; (F) velocity-time-curve of aortic flow rate (in this patient peak gradient 53 mmHg, regurgitant fraction 14%). LVOT, left ventricular outflow tract.

