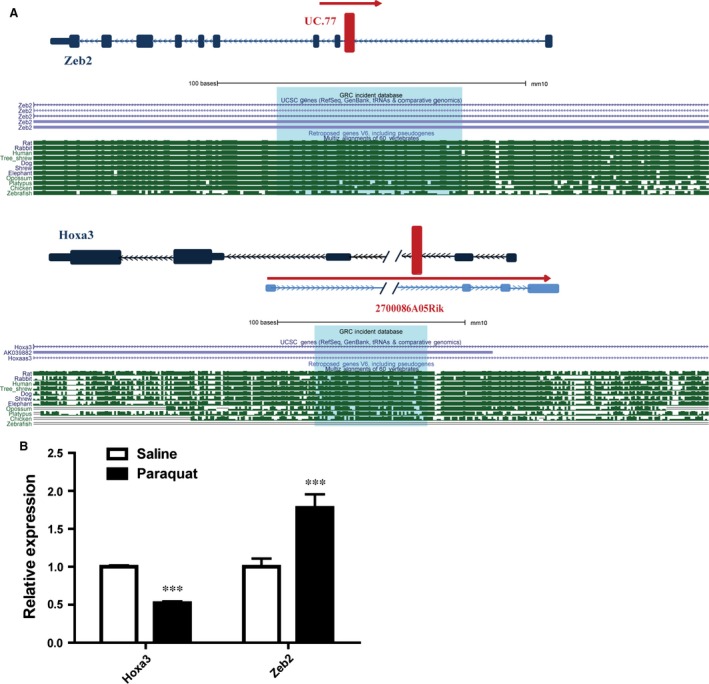
Figure 4.

Target gene prediction for uc.77 and 05Rik. (A) Schematic representation of uc.77 and 05Rik loci. The red box shows the location of lncRNAs relative to Zeb2 and Hoxa3 genes respectively. Lower panels show the sequence alignments of the lncRNA loci in various species. (Download the browser graphic from: http://genome.ucsc.edu/cgi-bin/hgGateway). (B) Q‐RTPCR results showing the differential expression of Hoxa3 and Zeb2 in saline‐treated versus paraquat‐treated lung tissues. Error bar represents biological replicates (n = 4). ***, P < 0.001 in comparison to saline‐treated control mice).
