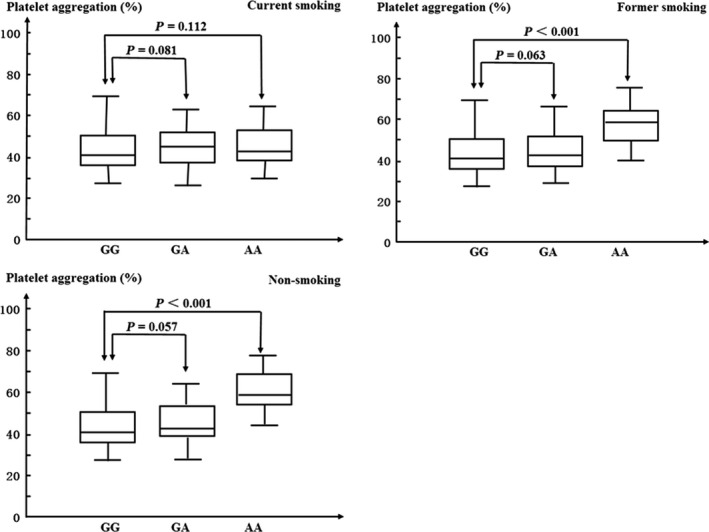
Figure 1.

Adenosine diphosphate (concentration 20 μmol/l) induced platelet aggregation stratified by smoking history. GG: CYP2C19 681 wild‐type homozygotes, GA: CYP2C19 681 mutant heterozygotes. AA: CYP2C19 681 mutant homozygotes. The horizontal line within each box represents the median. The lower and upper borders of each box represent the 25th and the 75th percentiles. The vertical line extends from the minimum to the maximum value.
