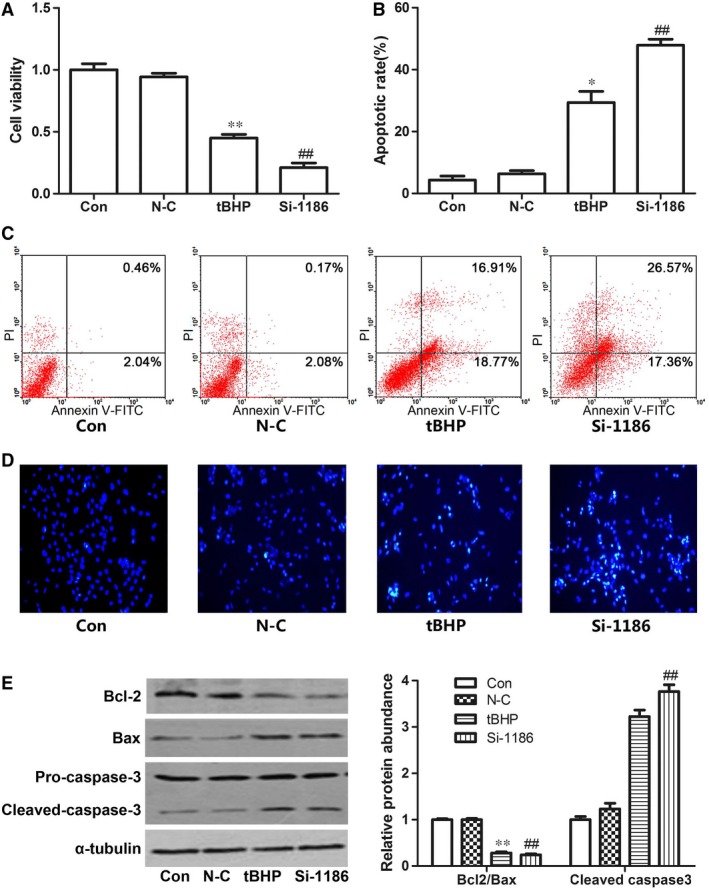
Figure 3.

The cell apoptotic in the cardiomyocytes treated with tBHP (200 μM, 6 hrs) or siRNA‐1186 (72 hrs). The changes of cell viability (A) and cell apoptotic rate (B and C) in the cardiomyocytes treated with tBHP (200 μM, 6 hrs) or siRNA‐1186 (72 hrs). (D) Cell apoptosis was determined with Hoechst 33258 staining. 200× magnification. (E) The expression of apoptosis‐related proteins in tBHP‐ or siRNA‐1186‐induced cardiomyocytes. N‐C: negative control siRNA. Mean ± S.D., n = 3, *P < 0.05; **P < 0.01 versus control. ##P < 0.01 versus N‐C.
