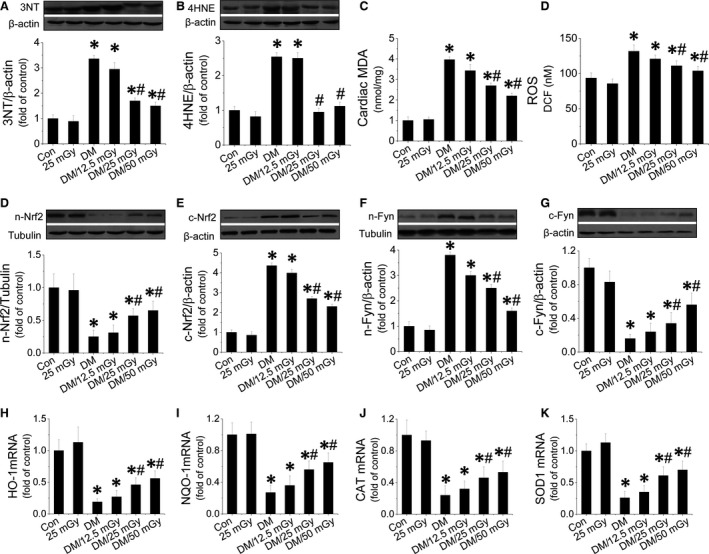
Figure 3.

Effect of LDR on diabetes‐induced oxidative stress in the diabetic hearts. Cardiac tissues from all four groups were collected to measure cardiac oxidative stress. Expression of the nitrosative damage marker 3‐NT (A) and the oxidative marker (B) were measured with Western blot. MDA (C) and cardiac ROS was measured (D) with ELISA. The translocation between the nuclei and cytosol of Nrf2 (D and E) or Fyn (F and G) was evaluated by measuring protein of each in the nuclei and cytosol respectively. Nrf2 function was measured by quantifying expression of Nrf2 downstream genes at the mRNA level including HO‐1 (H), NQO1 (I), CAT (J), SOD‐1 (K) with real‐time PCR. Data are presented as means ± S.D., n = 8/group. *P < 0.05 versus the Con group; # P < 0.05 versus the DM group.
