
Figure 6. Intracellular Ca2+ buffering does not affect adaptation in sv/sv OHCs .
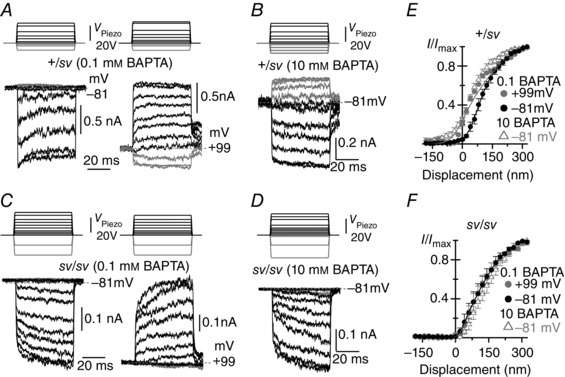
A–D, MET currents recorded from apical OHCs of +/sv (A and B, P4) and sv/sv (C and D, P4) mice in response to 50 ms force steps and in the presence of either 0.1 mm (+/sv: A; sv/sv: C) or 10 mm (+/sv: B; sv/sv: D) BAPTA in the intracellular solution. Recordings were performed at both −81 and +99 mV in 0.1 mm BAPTA (A and C) but only at −81 mV in 10 mm BAPTA (B and D). Note the absence of a resting MET current in sv/sv OHCs irrespective of BAPTA concentration or holding potential. E and F, averaged normalized peak MET current as a function of bundle displacement in +/sv (E) and sv/sv (F) OHCs. Data in 0.1 mm BAPTA were fitted with eqn (1). In +/sv (E) at −81 mV a 1 = 0.030 nm−1, a 2 = 0.010 nm−1, x 1 and x 2 = 76 nm; at +99 mV the parameters were as at −81 mV, except for x 1 = −7 nm, indicating a leftward shift of 83 nm. In sv/sv (F) at −81 mV a 1 = 0.059 nm−1, a 2 = 0.016 nm−1, x 1 = 36 nm and x 2 = 114 nm; at +99 mV the parameters were as at −81 mV, except for x 1 = 41 nm, indicating the absence of a leftward shift. Data in 10 mm BAPTA not fitted as they are from different cells. The average saturating MET current in 0.1 mm BAPTA was: −681 ± 82 pA (n = 3, +/sv) and −328 ± 42 pA (n = 5, sv/sv) at −81 mV; +1279 ± 222 pA (n = 3, +/sv) and +550 ± 87 pA (n = 5, sv/sv) at +99 mV; in 10 mm BAPTA: −753 ± 45 pA (n = 5, +/sv) and −386 ± 18 pA (n = 4, sv/sv) at −81 mV.