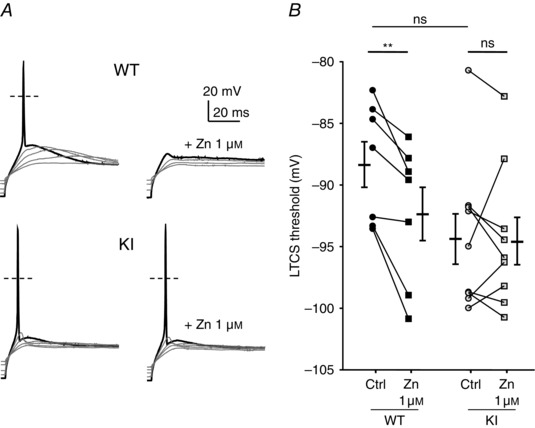
Figure 6. Rebound activity, low threshold calcium spike (LTCS) and its modulation by zinc in DRG neurons from WT and KI mice .

A, typical traces of the rebound potential LTCS evoked following 2 s hyperpolarizing steps of increasing amplitude in D‐hair neurons in control (left panel) and in the presence of zinc (1 μm, right panel) from WT (upper panel) and KI (lower panel) mice. B, LTCS threshold in control condition (circle) and in the presence of zinc (1 μm, square) in D‐hair neurons from WT mice (black symbols) and KI (grey symbols) mice. Statistical analysis was performed with repeated‐measures two‐way ANOVA (**P < 0.01; KI Ctrl vs. KI Zn 1 μm, P = 0.99; WT Ctrl vs. KI Ctrl, P = 0.09; WT Zn 1 μm vs. KI Zn 1 μm, P = 0.70).
