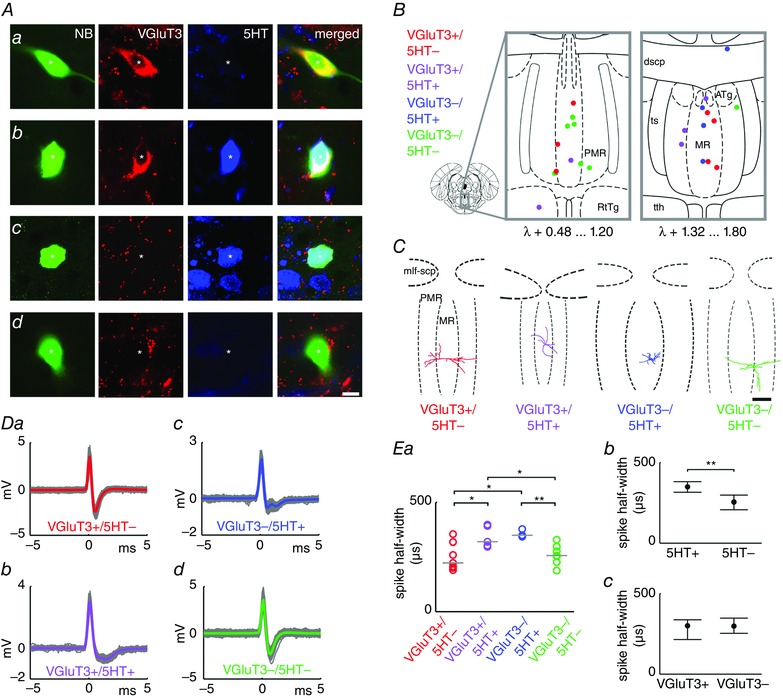
Figure 1. Examples and recording positions of all neurochemically identified MRR neurones .

Immunofluorescence images of example Neurobiotin (NB)‐filled neurones: VGluT3+/5‐HT– (Aa), VGluT3+/5‐HT+ (Ab), VGluT3–/5‐HT+ (Ac) and VGluT3–/5‐HT– (Ad) neurones. Asterisks indicate the soma. Scale bar = 10 μm. B, coloured dots indicate the position of recorded and neurochemically identified neurones overlaid onto two representative coronal diagrams of MRR (MR + PMR, based on Paxinos & Watson, 2005). ATg, anterior tegmental nucleus; dscp, decussation of the superior cerebellar peduncle; MR, median raphe nucleus; PMR, paramedian raphe nucleus; RtTg, reticulotegmental nucleus of the pons; ts, tectospinal tract; tth, trigeminothalamic tract. C, coronal projections of three‐dimensionally reconstructed dendritic arborization of four representative neurones. mlf‐scp, medial longitudinal fascicle and superior cerebellar peduncle; MR, median raphe nucleus; PMR, paramedian raphe nucleus. Scale bar = 300 μm. Da–Dd, spike waveform averages (plotted in colour) of corresponding neurones in (A). Ea, spike half‐width (grey lines: group medians). Kruskal–Wallis ANOVA: P = 0.0146. Wilcoxon rank sum test: *P < 0.05; **P < 0.01. Data grouped on the basis of 5‐HT (Eb) and VGluT3 (Ec) content (median + interquartile range).
