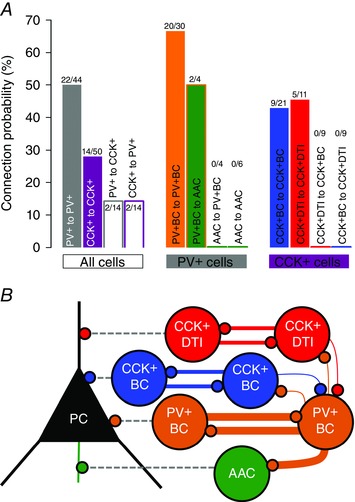
Figure 3. Homogeneous PTI pairs have frequent reciprocal connections .

A, CP among PV+ and CCK+ cell populations (filled grey bar, PV+ population; filled purple bar, CCK+ population; grey bar, PV+ to CCK+ population; purple bar, CCK+ to PV+ population), within the PV+ population and within the CCK+ population. Only cells with a preserved axonal tree were included in the counting. Note the higher CP between homogeneous cell pairs. B, representative scheme of the connection rules of PTI and DTI neurons (colours from Fig. 1). The thickness of the coloured lines represents the observed CP between interneuron pairs. For more details, see Table 3.
