
Figure 4. Properties of unitary IPSCs between interneuron–PC pairs depend on presynaptic cell type .
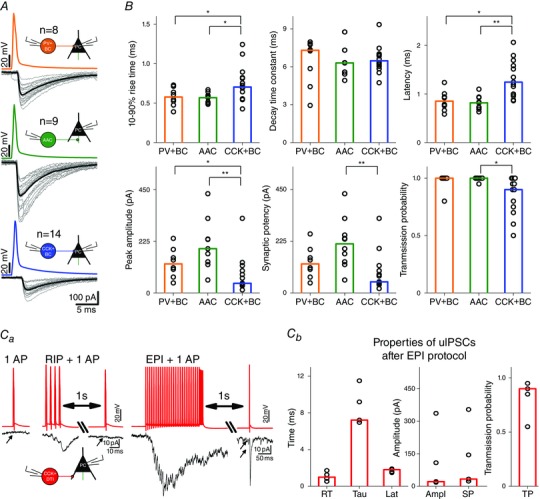
A, representative scheme of 20 superimposed uIPSCs (grey) between different classes of PTIs and PCs. The average of uIPSCs measured in PCs is shown in black. B, summary of 10–90% rise time (ms), decay time constant (τ, defined as the time constant of the single‐exponential fit to the decaying phase of averaged uIPSCs, ms), latency (ms), peak amplitude (pA), synaptic potency (amplitude of uIPSCs excluding failures, pA) and transmission probability (ratio of all action potentials and successful uIPSCs) for different connection types. Bars indicate the median of individual PTI–PC pair values (black circles). Asterisks indicate significant differences (*P < 0.05, **P < 0.01). PV+ cells evoked larger and quicker events with a shorter decay and higher probability than CCK+ cells. For more details, see Table 4. Ca, No uIPSCs in CCK+DTI–PC pairs for a single AP and for an AP following RIP protocol stimulation could be detected. A single AP could evoke uIPSCs only if it was preceded by EPI protocol stimulation. Cb, summary graph of uIPSCs at CCK+DTI–PC pairs following EPI protocol stimulation.