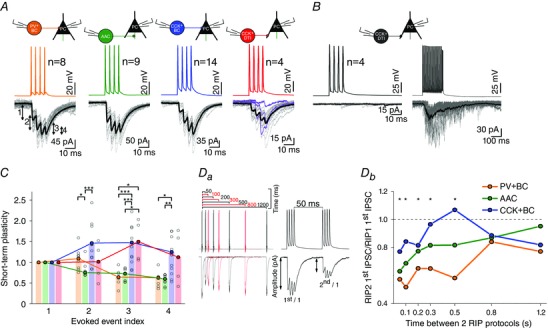
Figure 5. Short‐term plasticity of inhibitory transmission for physiological and pathological activity patterns is presynaptic cell type‐dependent .

A, representative examples of 20 superimposed IPSCs (grey lines) recorded from PCs, evoked by RIP protocol (a train of four action potentials at frequency of 160 Hz) in PV+BC (orange), AAC (green), CCK+BC (blue) and CCK+DTI (red). The steady‐state average of IPSCs is shown in black; purple lines at CCK+DTI–PC pairs represent the first three traces where the 1st AP of RIP protocol did not result in an IPSC. To analyse short‐term plasticity, the amplitudes of triggered IPSCs were normalized to the amplitude of 1st IPSC. B, left: RIP protocol evokes no response in four CCK+DTI‐PC pairs; right, by increasing the presynaptic firing rate at the same pairs (EPI protocol, 30 APs at 160 Hz + four APs at 320 Hz), synchronous release appears followed by asynchronous release after the 5th AP. C, summary of release dynamics recorded in PV+BC–PC, AAC–PC, CCK+BC–PC and CCK+DTI–PC pairs. Bars show the median of normalized peak amplitudes to the first IPSC amplitude for individual cell pairs (black circles). Amplitudes are plotted against stimulation number for each pair. Curves represent the calculated short‐term plasticity of the IPSC. The transmission of PV+BC–PC and AAC–PC pairs showed short‐term depression, whereas that of CCK+BC–PC and CCK+DTI–PC pairs showed short‐term facilitation. Da, left: recovery of transmission was calculated from two sets of RIP protocol trains, where the interstimulus interval between the final action potential of the first train and the first AP of the second train was varied between 50 and 1200 ms. Db, subsequently, the recovery ratio of evoked IPSCs was calculated (amplitude of the first IPSC of the second train divided by the amplitude of the first IPSC of the first train) and plotted against the interstimulus interval. Note, that PV+BC–PC (n = 7) and AAC–PC (n = 9) transmission gradually recovered, whereas CCK+BC–PC transmission (n = 11) showed a more complex (increasing and decreasing) behaviour depending on the interstimulus interval. Asterisks mark the significant difference between PV+BC–PC and CCK+BC–PC pairs for the given recovery time (*P < 0.05, **P < 0.01, ***P < 0.001).
