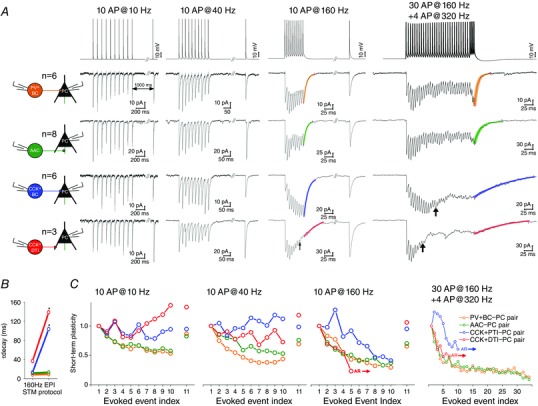
Figure 6. Short‐term plasticity of inhibitory transmission depends both on frequency and the type of the presynaptic cell .

A, representative steady‐state averaged IPSCs (from 20 sweeps, including failures) of PV+BC–PC, AAC–PC, CCK+BC–PC and CCK+DTI–PC pairs. IPSCs were evoked by a train of 10 APs at frequencies 10, 40 and 160 Hz (to measure short‐term depression, STD), followed by an additional 11th AP after 1 s (to measure recovery from STD), or by the EPI protocol (30 APs at 160 Hz + four APs at 320 Hz) mimicking the behaviour of PTIs during pathological interictal events. At CCK+PTI–PC pairs, asynchronous release appeared in response to the EPI protocol after the 10th AP (black arrow), whereas, at CCK+DTI–PC pairs, asynchronous release was observed during the 10 AP at 160 Hz stimulation train and EPI protocol after the 5th AP (black arrow). Coloured curves represent the single exponential fit function to the decay of the 10th IPSC at 160 Hz and EPI protocol stimulation. B, summary data of median values of decay time constant at different patterns. Asterisks indicate that the decay times of the CCK+BC and PTI cells were significantly longer after the EPI protocol, indicating that a delayed asynchronous release follows the last AP. C, summary of onset and recovery of short‐term plasticity of IPSCs (median of averaged values normalized by the amplitude of 1st IPSC), plotted against evoked events. Note that PV+BC–PC and AAC–PC pairs were characterized by short‐term depression at each frequency and stimulation pattern, whereas CCK+BC–PC and CCK+DTI–PC pairs displayed short‐term facilitation. AR, asynchronous release.
