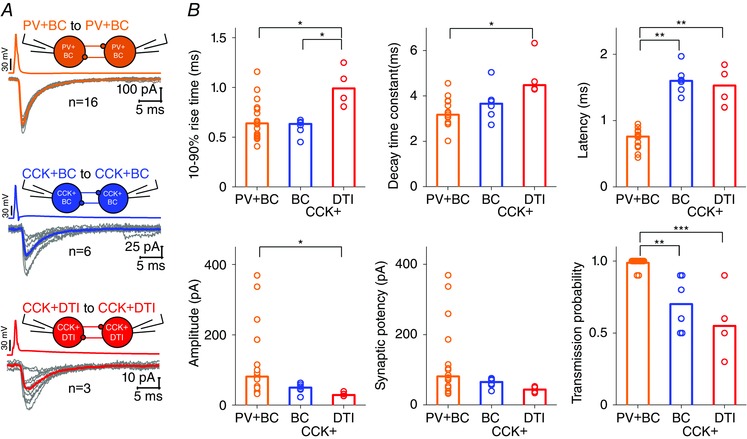
Figure 8. Differences in unitary IPSC properties in interneuron pairs .

A, representative example of 10 superimposed single uIPSCs (grey) triggered by 10 single action potentials between homologous PTI and CCK+DTI (red) pairs. Averages of uIPSCs are shown by the coloured line. B, summary graph of 10–90% rise time (ms), decay time constant (ms), latency (ms), peak amplitude (pA), synaptic potency (pA) and transmission probability. Bars indicate the median of individual cell pair transmission values (circles). Note that PV+BCs give rise to the most precisely timed (the shortest latency, rise and decay times) and efficient (the highest transmission probability) synaptic transmission. Asterisks indicate significant differences (*P < 0.05, **P < 0.01, ***P < 0.001).
