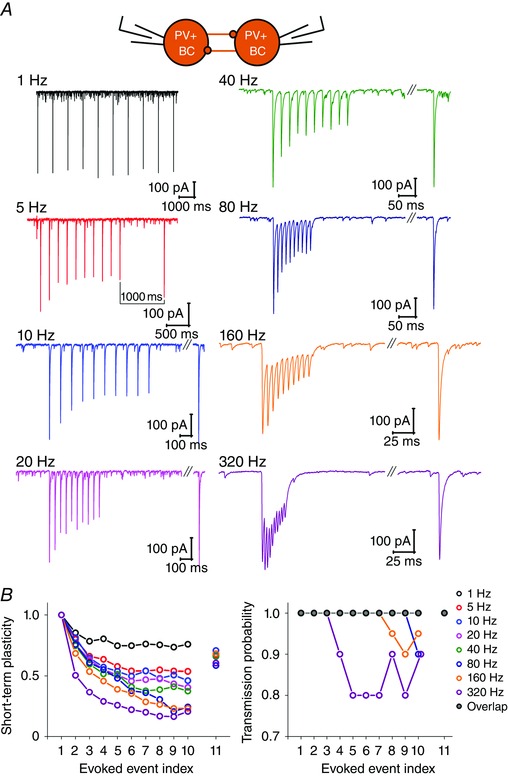
Figure 9. Properties of short‐term plasticity between PV+BCs .

A, representative traces of averaged IPSCs from PV+BC to PV+BC pairs, evoked by a train of 10 APs at frequencies 1, 5, 20, 40, 80, 160 and 320 Hz (to measure onset of short‐term depression, STD), followed by an additional 11th AP after 1 s (to measure recovery from STD). B, left: summary plot showing frequency‐dependent STD of IPSCs (median of averaged values normalized by the amplitude of first IPSCs for each PV+BC to PV+BC pair), plotted against evoked events (APs) at each frequency. Note that STD became more prominent as the frequency of stimulation was increased. The recovery from depression is also shown (normalized amplitude of 11th IPSC). Right: median value of transmission probability (TP) for each PV+BC to PV+BC pair, plotted against evoked events (APs) at each frequency. TP started to drop at stimulation frequencies 80 Hz and higher, and recovered by the time of the 11th stimulation.
