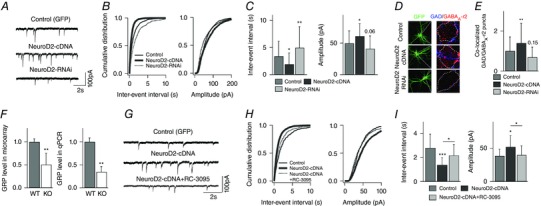
Figure 1. NeuroD2 regulates inhibitory synaptic development through GRP‐GRPR signalling in vitro .

A, representative mIPSCs recorded from cultured cortical neurons transfected with GFP (control), NeuroD2‐cDNA or NeuroD2‐RNAi plasmid. Scale bar, 100 pA, 2 s. B, cumulative distributions of mIPSC inter‐event intervals and amplitudes from neurons under the same conditions as in A. C, summary of mIPSC inter‐event intervals and amplitudes from neurons under the same conditions as in A (n = 30 for GFP, n = 36 for NeuroD2‐cDNA and n = 26 for NeuroD2‐RNAi. *P < 0.05; **P < 0.01). D, representative images of immunofluorescent labeling of GAD65 and GABAA‐γ2 in control, NeuroD2‐cDNA or NeuroD2‐RNAi neurons. E, summary of inhibitory synaptic puncta analysis in control, NeuroD2‐cDNA or NeuroD2‐RNAi neurons (n = 36 for GFP, n = 46 for NeuroD2‐cDNA and n = 32 for NeuroD2‐RNAi, **P < 0.01). F, GRP mRNA levels measured by microarray (n = 7 for both WT and KO) and by qPCR (n = 3 experiments each in triplicate format for both WT and KO) in 14 DIV cultured cortical neurons (**P < 0.01). G, representative mIPSCs recorded from cultured cortical neurons transfected with GFP and NeuroD2‐cDNA in a separate set of experiments. The GRPR antagonist RC‐3095 was added into the growth medium after transfection (scale bar, 100 pA, 2 s). H, cumulative distributions of mIPSC inter‐event intervals and amplitudes recorded from neurons transfected with GFP, NeuroD2‐cDNA or NeuroD2‐cDNA+RC‐3095. I, summary of mIPSC inter‐event intervals and amplitudes recorded from neurons transfected with GFP, NeuroD2‐cDNA or NeuroD2‐cDNA+RC‐3095 (n = 8 for GFP, n = 14 for NeuroD2‐cDNA and n = 11 for NeuroD2‐cDNA+RC‐3095; *P < 0.05, ***P < 0.001).
