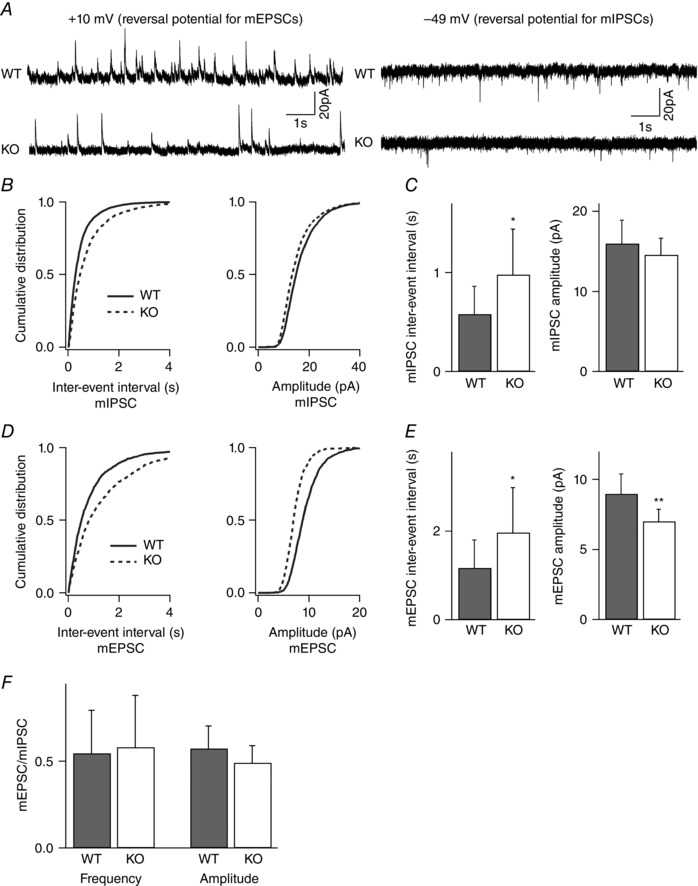
Figure 4. Frequency of both inhibitory and excitatory quantal events is reduced in layer II/III pyramidal neurons of NeuroD2 null mice .

mIPSCs and mEPSCs recorded from the same layer II/III pyramidal neurons in the presence of TTX. A, sample traces from WT and mutant neurons voltage clamped at +10 mV for mIPSCs and −49 mV for mEPSCs (scale bar, 20 pA, 1 s). B, cumulative distributions of inter‐event interval and amplitude from all mIPSCs events of 11 WT neurons and 13 mutant neurons showed a significant rightward shift in the mIPSC frequency for mutant neurons. C, average data of mIPSC inter‐event intervals and amplitudes showed a significant decrease in mIPSC frequency (increased IEI) in KO neurons (n = 11 for WT and n = 13 for KO; *P < 0.05). D, cumulative distributions of inter‐event interval and amplitude from all mEPSCs events of 11 WT neurons and 13 mutant neurons showed a significant rightward shift in the mEPSC frequency and a leftward shift in the mEPSC amplitude for mutant neurons. E, average data of mEPSC inter‐event intervals and amplitudes showed a significant decrease in mEPSC frequency (increased IEI) and amplitude in KO neurons (n = 11 for WT and n = 13 for KO; *P < 0.05, **P < 0.01). F, the ratio of mEPSC to mIPSC IEI and amplitude was unchanged in NeuroD2 mutant neurons compared to WT.
