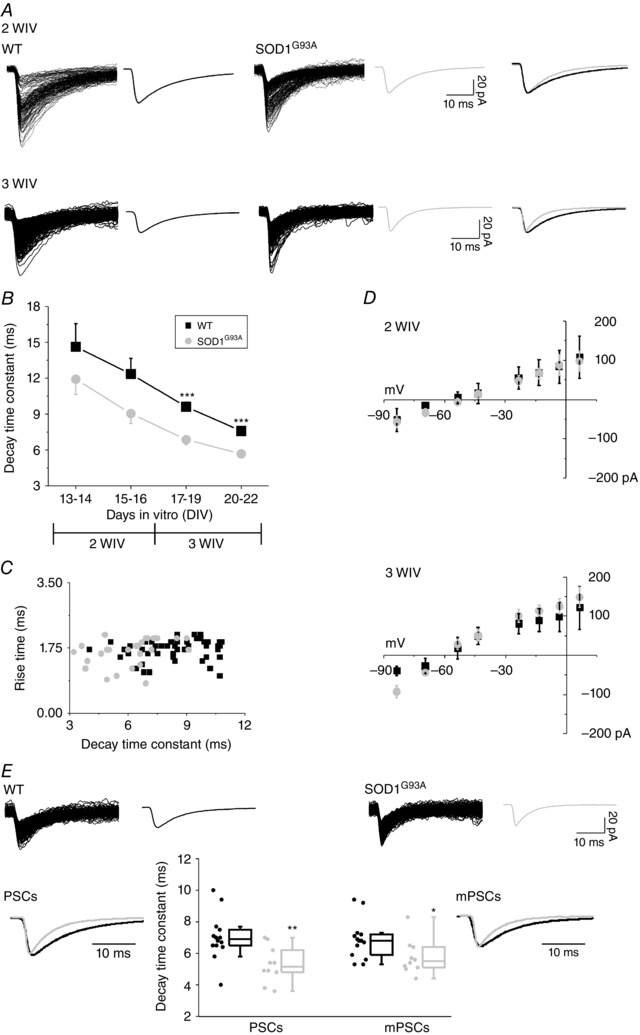
Figure 2. SOD1G93A gly‐PSCs decay faster than WT gly‐PSC after in vitro development .

A, superimposed traces show pharmacologically isolated gly‐PSCs recorded from WT (left) and SOD1G93A (middle) ventral interneurones at 2 WIV (top row) and 3 WIV (bottom row; average PSCs to the side). The traces to the right are WT (black) and SOD1G93A (grey) average traces superimposed and scaled to the peak to highlight the different decay time. B, plot of the changes in the decay time constant (τ) during in vitro growth (overall 74 WT and 52 SOD1G93A; divided by DIV: 13–14 DIV, 6 WT and 10 SOD1G93A; 15–16 DIV, 12 WT and 10 SOD1G93A; 17–19 DIV, 26 WT and 16 SOD1G93A; 20–22 DIV, 30 WT and 16 SOD1G93A). C, scatter plot of rise time vs. decay time; in both WT and SOD1G93A at 3 WIV (56 WT and 32 SOD1G93A) regression analysis reveals no linear relationship between these two parameters (r = 0.2344, probability = 0.095 and r = 0.3435, probability = 0.093 for WT and SOD1G93A neurons, respectively). D, I–V curves were obtained by plotting gly‐PSCs mean amplitude against Vh at 2 WIV (top) and 3 WIV (bottom) for WT and SOD1G93A ventral interneurons (31 WT and 23 SOD1G93A). Note that the approximate calculated reversal potential was –55 mV at 2 WIV and –60 mV at 3 WIV. E, superimposed individual WT and SOD1G93A gly‐mPSCs and average mPSCs (top row). The estimated average gly‐PSC and mPSC charges (area under the curve) were: WT 459.7 ± 83.4 pA × ms and 170.2 ± 19.5 Pa × ms, PSCs and mPSCs, respectively; SOD1G93A 294.9 ± 33.2 pA × ms and 139.5 ± 15.2 pA × ms, PSCs and mPSCs, respectively. Bottom row: box plots of the decay time constants of WT and SOD1G93A glycinergic PSCs and mPSCs (14 WT and 10 SOD1G93A); superimposed average and scaled tracings are gly‐PSCs (left) and gly‐mPSCs (right) for WT (black) and SOD1G93A (grey). *P < 0.05; **P < 0.01; ***P < 0.001.
