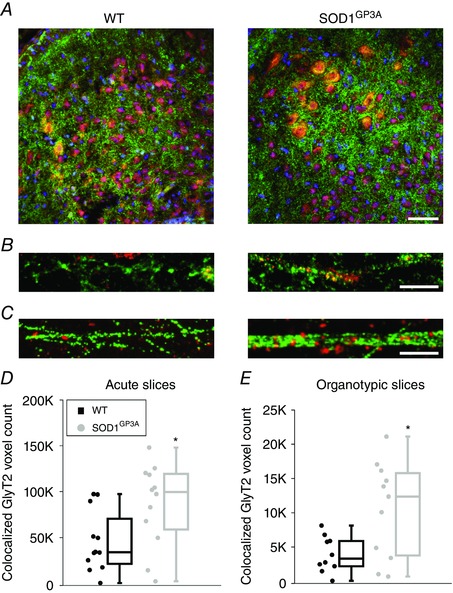
Figure 4. Co‐localization of GlyT2 and GAD65 immunostaining in the WT and SOD1G93A immature spinal cord .

A, confocal images of the ventral horn of WT and SOD1G93A acute spinal slices isolated from neonatal (P0) mice and stained for GlyT2 (green) and GAD65 (red). B, confocal high magnification of a region (from A) showing the appearance of GlyT2 (green) and GAD65 (red) clusters. Co‐localization of GlyT2 (green) and GAD65 (red) clusters identify mixed synapses. C, organotypic cultures: confocal high magnification of the ventral area of WT (left) and SOD1G93A (right) cultured slices at 3 WIV, similar to the acute ones, co‐localization of GlyT2 (green) and GAD65 (red) clusters identifies mixed synapses. D and E, box plots show that co‐localized GlyT2 and GAD65 clusters are more common in SOD1G93A (grey) spinal slices than in WT slices (black). This was seen both in acute slices (P0) (D, number of ROIs: 12 WT and 12 SOD1G93A) and in cultured slices (3 WIV) (E, number of ROIs: 12 WT and 12 SOD1G93A). Scale bar = 50 μm in (A), 10 μm in (B and C). *P < 0.05.
