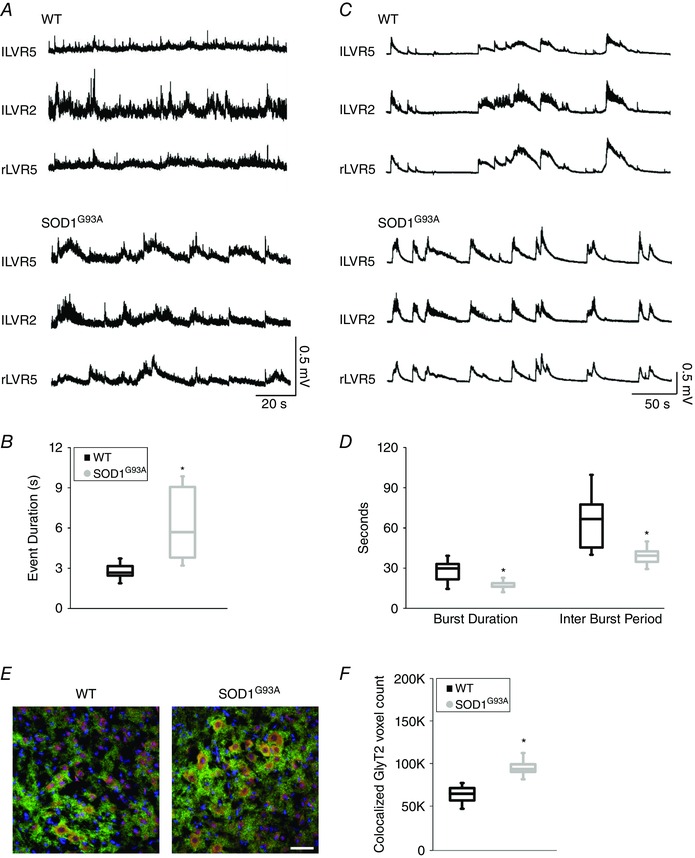
Figure 5. Motor output in WT and SOD1G93A spinal cords isolated from P3 old mice .

A, representative traces of spontaneous activity simultaneously recorded from left (l) and right (r) lumbar VR 5 (LVR5) and 2 (LVR2) in WT (top) and SOD1G93A (bottom) spinal cords. B, box plots of event duration for WT (black, n = 7) and SOD1G93A (grey, n = 5) spinal cord preparations. C, representative traces of VR activity recorded in the presence of SR‐95531 in WT (top) and SOD1G93A (bottom) spinal cords. D, box plots of burst duration and interburst period in WT (black, n = 7) and SOD1G93A (grey, n = 5) mice. E, confocal images of ventral horn of WT (left) and SOD1G93A (right) spinal cords (same preparations as recorded in B), the co‐localization of GlyT2 (green) and GAD65 (red) clusters identify mixed synapses. F, box plots show the greater co‐localization of GlyT2 and GAD65 clusters in SOD1G93A spinal tissue (same preparations as recorded in B; number of ROIs: 5 WT and 5 SOD1G93A). Scale bar = 50 μm. *P < 0.05.
