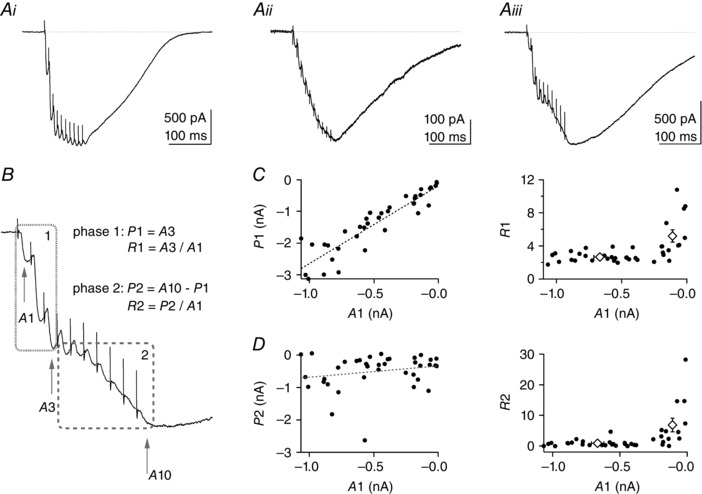
Figure 1. Analysis of the parallel fibre (PF) train EPSC shows that it can be divided into two phases .

Parallel fibre train EPSCs were elicited by 10 stimuli at 100 Hz repeated once per minute. Stimulation artefacts have been partly removed for clarity. A, three examples of PF train EPSCs with different facilitation behaviour: i, saturating; ii, increasing progressively throughout the train; and iii, hybrid of the first two. B, example Aiii is used to illustrate the analysis of the PF train EPSC in two separate phases: phase 1 characterized by amplitudes A1 and A3 of the first and third responses, respectively; and phase 2 characterized by the amplitudes A3 and A10 of the 10th response. R1 = A3/A1 is the amplitude of phase 1 normalized to the initial response, A1. It is a measure of facilitation after three stimuli. P2 = A10 − A3 is the amplitude of phase 2. R2 = P2/A1 is the amplitude of phase 2 normalized to the initial response, A1. We come back to the significance of R2 in the last panel. C, left panel, plot of P1 vs. A1 for individual cells (n = 38) shows correlation between these parameters (Pearson's coefficient = 0.917, P < 0.001). The standard deviation of the baseline current noise was 3.05 pA (n = 38) and the smallest A1 current measured was −11.9 pA. Even the smallest A1 values were well distinguished from baseline. C, right panel, plot of R1 vs. A1. Open diamonds correspond to mean R1 values for PF train EPSCs with large and small A1 values (inward currents >200 and <200 pA, respectively). R1 is typically larger for small values of A1, where the train EPSC is dominated by progressively increasing responses (as in A ii). D, left panel, plot of amplitudes P2 vs. A1. There is no significant correlation of the amplitudes of the two phases (Pearson's coefficient = 0.215, P > 0.1). D, right panel, plot of R2 vs. A1. Given that A1 and P1 are strongly correlated, R2 = P2/A1 is a relative measure of the amplitude of phase 2 with respect to that of phase 1 and reports on the proportion of the two phases of the train EPSC. Open diamonds correspond to mean R2 values for PF train EPSCs analysed in the large and small A1 amplitude categories defined above. SR 95531 (3 μm) and d‐APV (50 μm) were present in all recordings; 32 of 38 cells were from transverse slices, six of 38 from sagittal slices.
