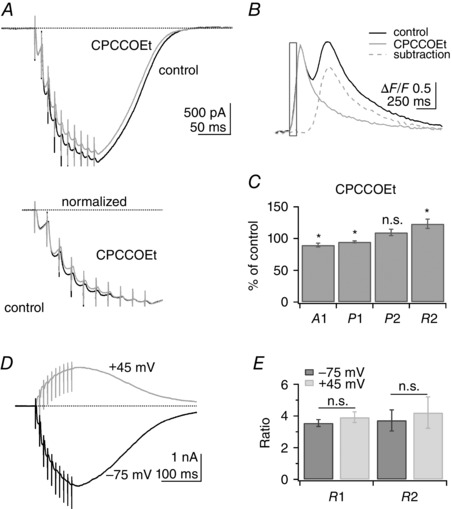
Figure 2. Role of metabotropic glutamate receptor 1 (mGluR1) and voltage‐gated conductances .

A, top panel, example of a PF train EPSC recorded in control conditions (black trace) and in the presence of the mGluR1 antagonist CPCCOEt (50 μm, grey trace). A, bottom panel, traces normalized to A10. mGluR1 inhibition has little effect on the train EPSC. B, ΔF/F signals associated with the train EPSC in control conditions (black trace) and CPCCOEt (grey trace). Subtraction of the signal in CPCCOEt from control conditions shows the inhibition of the mGluR1‐mediated calcium signal (dotted grey trace). C, A1, P1, P2 and R2 in CPCCOEt as a percentage of control values for 14 cells. Wilcoxon signed rank test, *P < 0.01; n.s., not significant (n = 14, P = 0.075). Although CPCCOEt slightly modifies the train EPSC, there is no inhibition of phase 2, indicating that this component of the train EPSC is not generated by activation of mGluR1 receptors. D, example of a PF train EPSC recorded at −60 mV (−75 mV after correction for liquid junction potential; black trace) and after 5 min at +60 mV (+45 mV after correction; grey trace). Steady‐state depolarization is expected to inactivate voltage‐gated conductances. E, average values of R1 and R2 at −75 and +45 mV were not significantly different, indicating that voltage‐gated conductances do not affect the relative proportion of phase 1 and 2 (n = 10; Wilcoxon signed rank test for R1, P = 0.084 and R2, P = 0.49). Bars indicate SEM. SR 95531 (3 μm) and d‐APV (50 μm).
