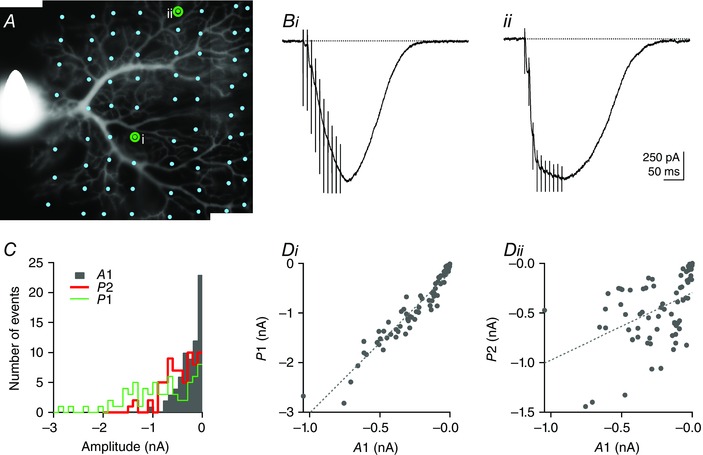
Figure 3. Facilitation is a local property of dendritic sites .

A. morphology of a Purkinje cell loaded with 20 μm Alexa‐488. The PF train EPSC was systematically probed at different locations of the dendritic tree by moving the stimulation pipette (dots denote the position of the tip of the pipette; 71 locations tested in this example) in sagittal slices. i and ii mark the positions of the stimulation pipette corresponding to the PF train EPSCs shown in B. The train EPSCs display similar maximal amplitudes but very different facilitation during the train. Bi, a PF train EPSC that builds up. Bii, a saturating example. C, histogram of A1, P1 and P2 showing the wide distribution of these parameters and the heterogeneity of the amplitude of the two phases. Di, plot of P1 vs. A1 showing a strong correlation between these parameters (Pearson's coefficient = 0.959, P ≪ 0.001), as observed for values from different cells (Fig. 1). Dii, plot of P2 vs. A1. P2 and A1 are significantly correlated (Pearson's coefficient = 0.456, P < 0.001), although less strictly and mostly because of a strong correlation for train EPSCs where A1 was very small. SR 95531 (3 μm) and d‐APV (50 μm).
