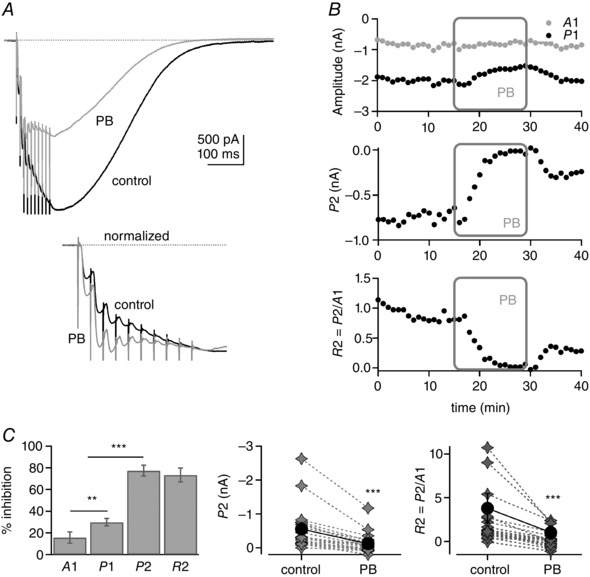
Figure 4. Pentobarbital inhibits phase 2 of the PF train EPSC .

A, top panel, example of a PF train EPSC in control conditions (black trace) and after bath application of 110 μm pentobarbital (PB; grey). Inhibition is strongest at the end of the train. A, bottom panel, traces normalized to A10. In pentobarbital (grey trace), phase 2 is inhibited more potently than phase 1. This converts the train EPSC from a hybrid to a saturating pattern. B, plots of A1, P1, P2 and R2 during the course of the experiment. The pentobarbital application decreased P2 most efficiently but had little effect on A1. C, left panel, percentage inhibition by pentobarbital of A1 and P1 for 22 cells, and P2 and R2 for 14 cells. Some P2 values were negative in pentobarbital (A10 smaller than A3), presumably reflecting overlap in the two components (see Results). The inhibitions of P2 and R2 were calculated for train EPSCs with P2 values larger than 150 pA (14 cells). C, right panels, individual and average values of P2 and R2 for all 22 cells (grey diamonds, individual cells; black circles, mean values ± SEM). All changes were statistically significant. For the illustration, **P = 0.002 and ***P ≪ 0.001. Bars indicate SEM. SR 95531 (3 μm) and d‐APV (50 μm). Sixteen of 22 cells were from transverse slices and six from sagittal slices.
