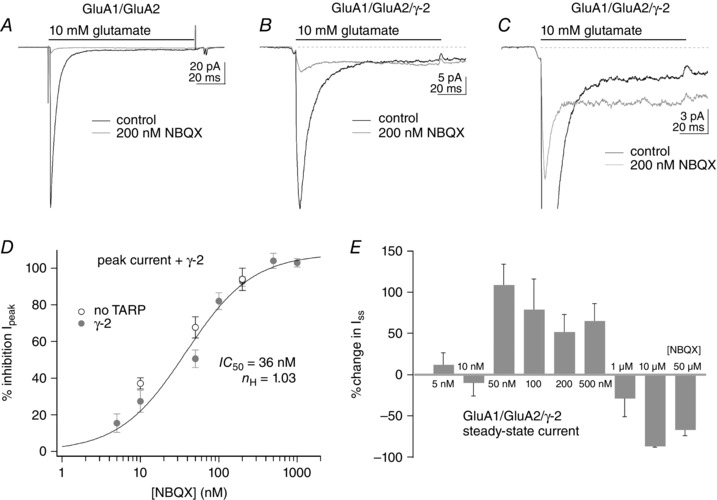
Figure 8. The steady‐state current (Iss) during sustained applications of glutamate is resistant to inhibition by NBQX .

A–C, responses to 100 ms applications of 10 mm glutamate before (black traces) and during the continuous application of 200 nm NBQX (grey traces). In patches from cells expressing GluA1 and GluA2 alone (A), NBQX markedly reduced both peak and steady‐state currents. In patches from cells that also expressed γ‐2, 200 nm NBQX markedly reduced the peak responses, but the steady‐state currents were either little affected (B) or even larger than control currents (C). D, concentration–response data for NBQX inhibition of the peak current in patches from cells expressing GluA1 and GluA2 alone (open circles) or co‐expressing γ‐2 (filled grey circles). A Hill‐type fit to the data from patches co‐expressing γ‐2 gave IC50 and n H values of 36 nm and 1.03, respectively. The data for GluA1 and GluA2 without γ‐2 (open circles) gave percentage inhibition values similar to the corresponding values with γ‐2 at the three concentrations tested. Bars indicate SEM (three to eight values per point). E, mean percentage change in the I ss for GluA1/GluA2/γ‐2 heteromeric receptors over a 10,000‐fold range of NBQX concentrations. Note that, on average, NBQX concentrations that substantially reduce peak currents (D) increase the size of the I ss. The data for NBQX concentrations ≤1 μm are from the same patches as in D. The data for 10 and 50 μm NBQX are from two patches each (both concentrations completely inhibited the peak current). Bars indicate SEM.
