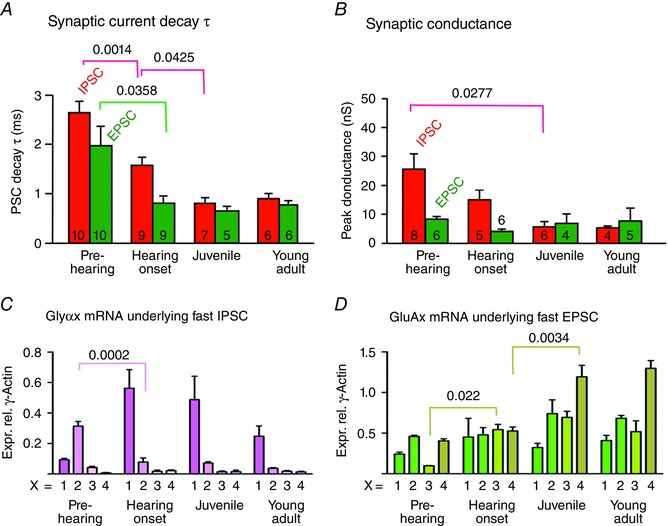
Figure 4. Mean data showing acceleration in synaptic decay and reduced conductance with changes in the subunit mRNA levels across development .

A, bar charts summarizing EPSC (green, mean ± SEM) and IPSC (red) decay τ. B, conductance for the four age groups of mice used in this study. Sample size (n) is indicated in the respective bar. EPSCs and IPSCs converge to similar time‐course and conductance in Juvenile and Young adult mice. Significant changes are indicated by the line and P value. C, plot of the GlyR subunit mRNA expression (x = Glyα1–4) relative to γ‐actin in the LSO for the four age groups used in this study (n = 3), showing the early switch from Glyα2 to Glyα1 as significant, as indicated by the lines and P values. D, glutamate receptor subunit mRNA expression (x = GluA1–4) for the four age groups (n = 3). There are significant increases in GluA3 from Pre‐hearing to Hearing onset and for GluA4 on maturation from Hearing onset to Juvenile. Significance of changes between age groups was assessed by one‐way ANOVA and indicated as values of P between the respective data.
