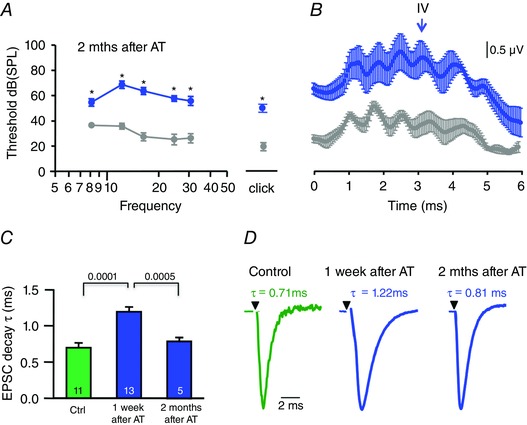
Figure 9. The AT‐induced plasticity in the LSO EPSC is reversible .

A, plot showing average ABR thresholds at 8–30 kHz (mean ± SEM) and for a click stimulus. Thresholds remained elevated 2 months after AT (blue) at around P90, compared to similar aged mice which received no AT (grey). B, averaged ABRs (24 kHz, tone pip at 94 dB SPL, mean ± SEM) for the same data set, showing that wave IV is present in control and on recovery from AT by around P90. C, AMPAR‐EPSC decay time‐constants (τ) were measured from the same mice as in A and B. Bar chart shows EPSC decay τ (mean ± SEM) from unexposed mice (control, green) and mice that received AT 1 week earlier (blue, n = 13) or months earlier (blue, n = 5). D, representative AMPAR‐EPSC averages (n = 20) for each group; the slowed EPSC decay τ had recovered to control values 2 months after AT induction. Significance was assessed by two‐way ANOVA for tone frequencies (P < 0.0008) and unpaired t test for clicks in A (P = 0.002) and by one‐way ANOVA in C (P values as indicated).
