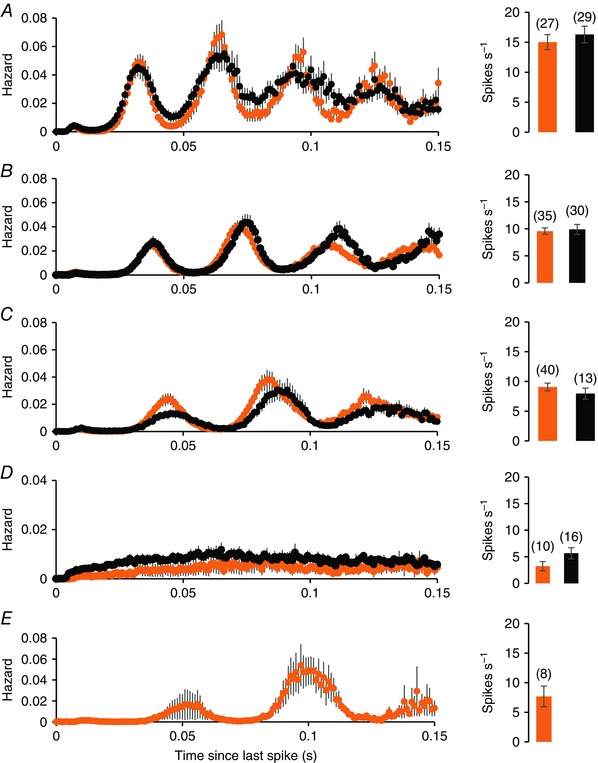
Figure 8. Hazard functions of light‐on cells recorded in the subjective day in bright light (orange) and light‐on cells recorded in the subjective night in dark conditions (black) .

A, B and C, harmonic cells sorted by fundamental frequency: 50–29 Hz (A), 29–25 Hz (B) and 26–16 Hz (C). D, hazard functions of non‐harmonic cells, and (E) shows hazard functions of a subgroup of cells recorded in the subjective day with an unusually long fundamental frequency. For each group, the plots are mean ± SEM hazards. To the right of the hazard functions, the bars show the mean ± SEM firing rates of the subgroups, with the number of cells in each subgroup in parentheses. There is no significant difference in the mean firing rate of light‐on cells between the two conditions.
