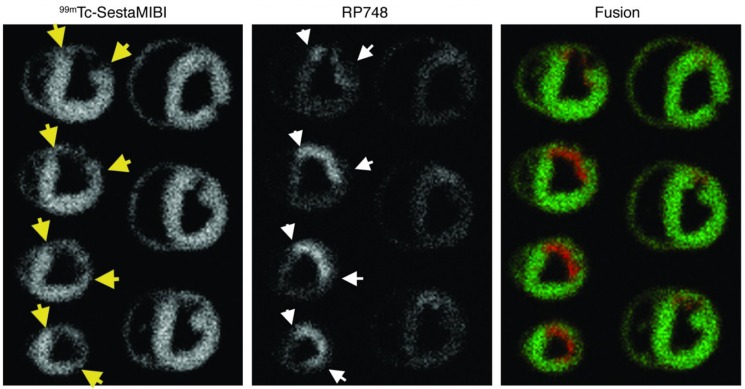
Figure 1.
Integrin αvβ3-targeted imaging of myocardial angiogenesis. Example of ex vivo 99mTc-sestamibi (reflecting perfusion, (left)) and 111In-RP748 (reflecting αvβ3 integrin expression and activation, (center)) and fused color-coded (right) images of canine myocardium at three weeks post myocardial infarction induced by left anterior descending coronary artery occlusion. Yellow arrows point to the margins of the perfusion defect, and white arrows show the area of increased 111In-RP748 uptake. On fused images perfusion tracer uptake is in green. RP748 accumulation (in red) is localized in the areas of perfusion defect. Published with permission of the American Society for Clinical Investigation, from “Noninvasive imaging of myocardial angiogenesis following experimental myocardial infarction”, Meoli, D.F., et al. J. Clin. Invest. 2004, 113(12), 1684–1691 [38]; permission conveyed through Copyright Clearance Center, Inc.

