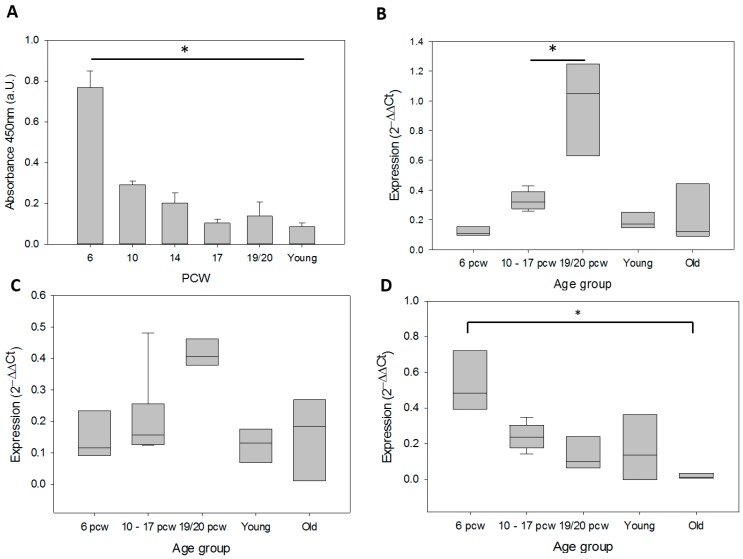
Figure 1.
Telomerase activity and expression of telomerase-related genes in fetal brain, young and old cortices. (A) Telomerase activity, mean and SD, TA at 6 pcw was significantly different from all other time points; (B) α-spliced hTERT, the values for 19/20 pcw are significantly different from those on 10–17 pcw; (C) WT hTERT, (D) hTR expression at 6 pcw was significantly different from old brains. (B–D) are not normally distributed and have been normalised to SH-SY5Y controls and their 2−ΔΔCt set as 1. The box plots show mean and SD of n = 3 for the 6 pcw and 19/ 20 pcw groups, and n = 6 for the 10–17 pcw groups. Box-plots show the median with 25% and 75% interval in the box, whiskers the 10% and 90%. One way ANOVA (on ranks for (B–D)) and Holm-Sidak post hoc tests were performed to determine statistical significance. * p < 0.05.

