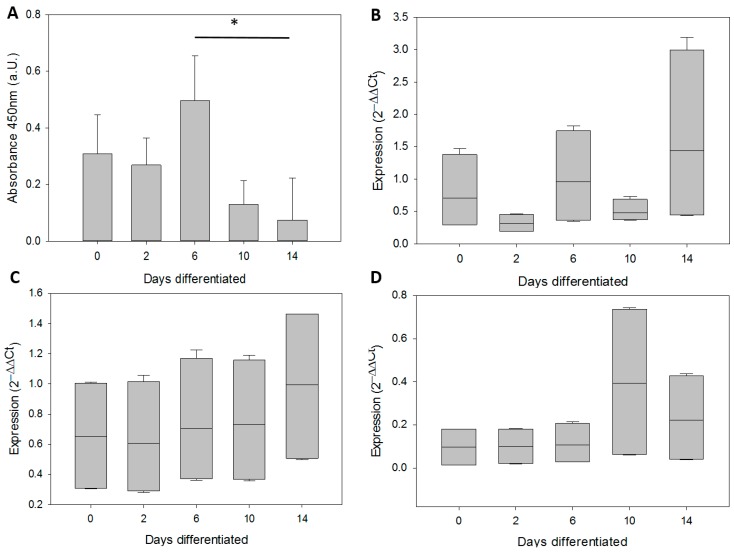
Figure 4.
Telomerase activity and expression of telomerase-related genes in neural precursor stem cells and their differentiated progeny. (A) Telomerase activity, mean and SD from 2 independent differentiation experiments with significant differences between day 6 and 14; (B) α-spliced hTERT; (C) WT hTERT; (D) hTR expression. (B–D) have been normalised to SH-SY5Y, where 2−ΔΔCt was set to 1. * p < 0.05. One way ANOVA (on ranks for (B–D)) and Holm-Sidak post hoc test was performed was performed on these data. The bars show mean and SD of n = 2 (independent qPCR runs) for all groups in (B–D).

