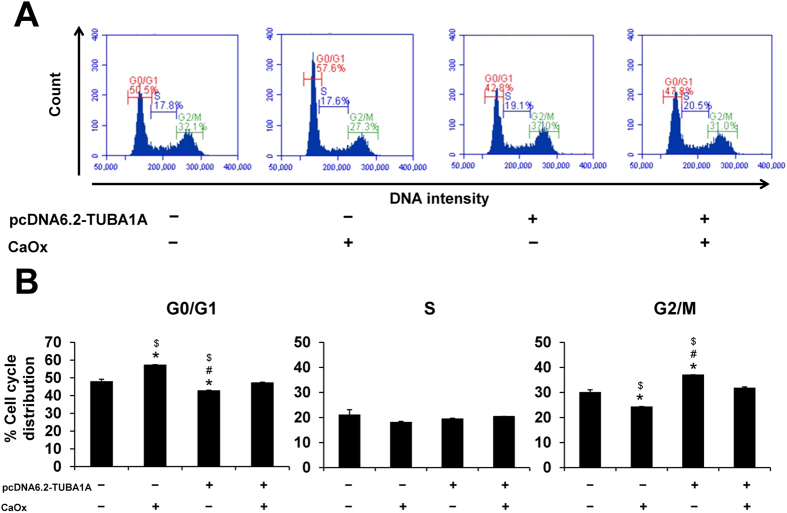
Figure 5. Effect of α-tubulin overexpression on cell cycle.
Evaluation of cell cycle was performed by flow cytometry. (A) Representative flow cytometric data of cell cycles stained with propidium iodide. (B) Quantitative and statistical analyses of cell-cycle phases (G0/G1, S, and G2/M). The data are reported as mean ± SEM (n = 3 independent experiments). *p < 0.05 vs. WT; #p < 0.05 vs. WT + CaOx; $p < 0.05 vs. pcDNA6.2-TUBA1A + CaOx.

