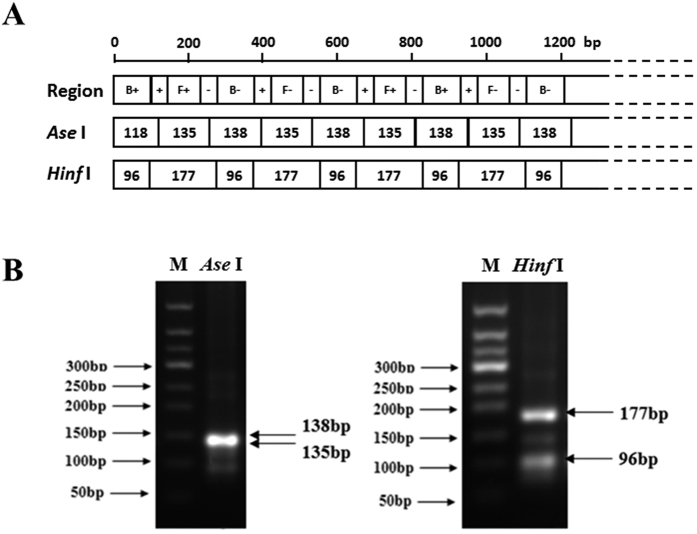
Figure 2. Restriction enzyme digestion of the positive LAMP products.
(A) Schematic representation of the anticipated restricted DNA products. B+, B−, F+, F−,+ and-in the first row represent the same regions described by Notomi (Notomi et al.4). (B) LAMP products were digested with Ase I and Hinf I, and the fragments were observed by 2.0% agarose gel electrophoresis.

