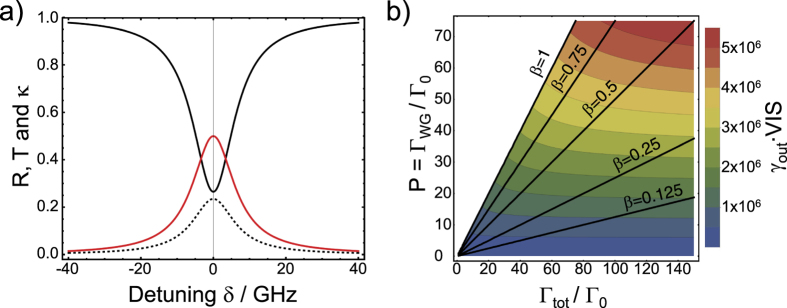
Figure 8. Performance of the single-photon transistor.
(a) Reflectance R (dashed), transmittance T (solid black) and losses κ (solid red) as a function of detuning δ for the optimum values found for P and β as shown in Fig. 7b,c, however including a ηZPL of 0.5. (b) Performance γout ⋅ VIS of the chip expected for a concrete experiment in which transmission dips are traced as a function of normalized total decay rate Γtot/Γ0 and Purcell factor P. Every emitter position and orientation translates into a different position in this contour plot. The black lines mark specific β-factors. The white area refers to values of β > 1, which are not possible.

