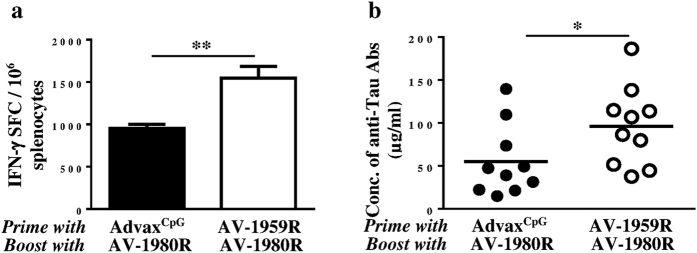
Figure 8. Humoral and cellular immune responses in mice vaccinated twice with AV-1959R and boosted (single boost) with AV-1980R formulated with AdvaxCpG adjuvant.
(a) Numbers of IFN-γ producing cells were detected by ELISpot in splenocyte cultures. Bars represent average ± SD for n = 4/per group. (b) Concentrations of anti-tau antibodies were measured by ELISA. Lines represent mean values for n = 10/per group (*P < 0.05, **P < 0.01, t-test).

